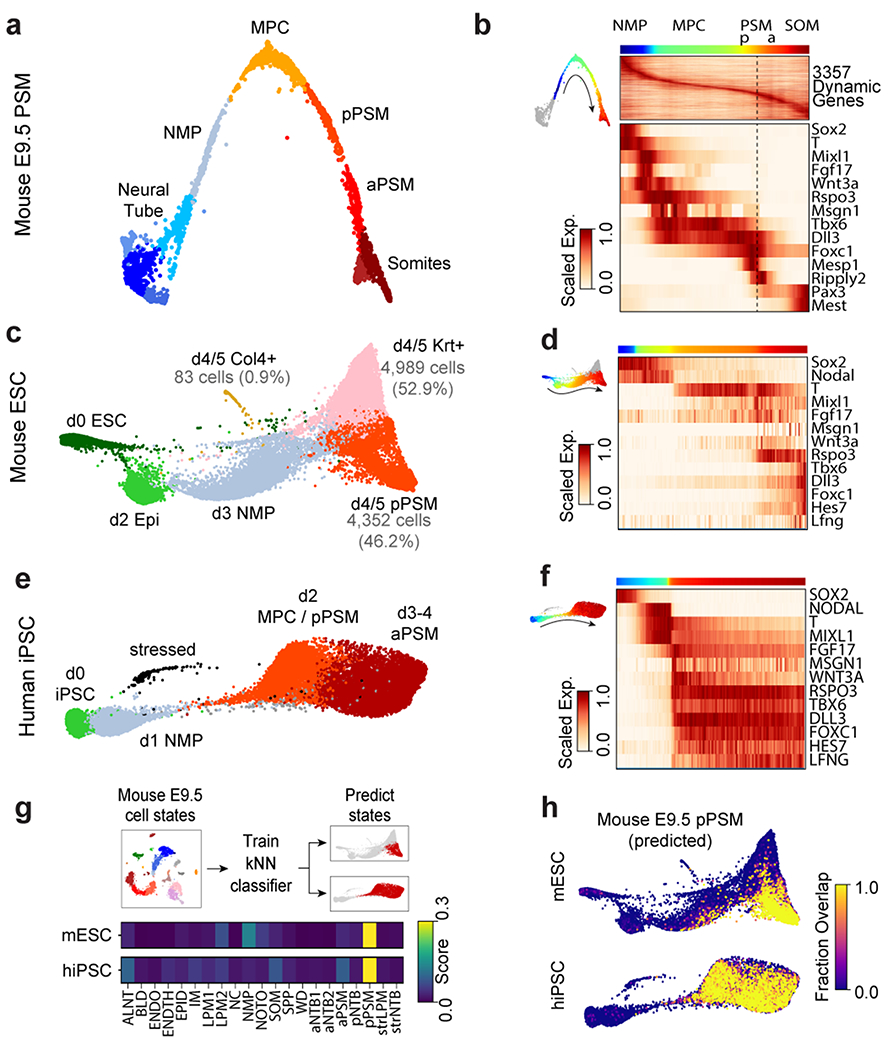
Figure 2. Single cell RNA-sequencing analysis of differentiating mouse and human PSM.

a, Nearest-neighbor (kNN) graph of mouse E9.5 neural tube, PSM, and somite clusters (2,340 cells, 20 PC dimensions), visualized with ForceAtlas2 and colored by Louvain cluster ID. b, Pseudo-temporal ordering of non-neural E9.5 cells. Heatmap illustrates genes with significant dynamic expression ordered by peak expression (see Methods) and selected markers of paraxial mesoderm differentiation. Color bars indicate pseudotemporal position and Louvain cluster assignments. Dotted line marks the determination front (boundary between anterior/posterior PSM). c, Batched-balanced kNN graph of mouse ESC single-cell transcriptomes (21,478 cells), colored by Louvain cluster ID and visualized with ForceAtlas2. Cell numbers for the three terminal day 4/5 states are indicated. d, Pseudo-temporal ordering of mESCs along a path towards the putative d4/5 PSM state. Heatmap shows selected markers of paraxial mesoderm differentiation. e, Batched-balanced kNN graph (ForceAtlas2 layout) of hiPSC single-cell transcriptomes (14,750 cells), colored by Louvain cluster ID. f, Pseudo-temporal ordering of hiPSCs along a path towards the terminal d3/4 PSM state. Heatmap shows selected markers of paraxial mesoderm differentiation. g, Machine-learning classification of human and mouse in vitro cultured cells. A kNN-classifier trained on E9.5 clusters was used to predict identities of terminal in vitro states (inset, red cells). Heatmaps depict fraction of E9.5 assignments for mESC day 4/5 PSM cells and hiPSC (day 2-4 cells). h, Overlay of kNN-classifier scores (fraction of nearest neighbors with the E9.5 ‘pPSM’ label) onto the mESC and hiPSC kNN graphs.
