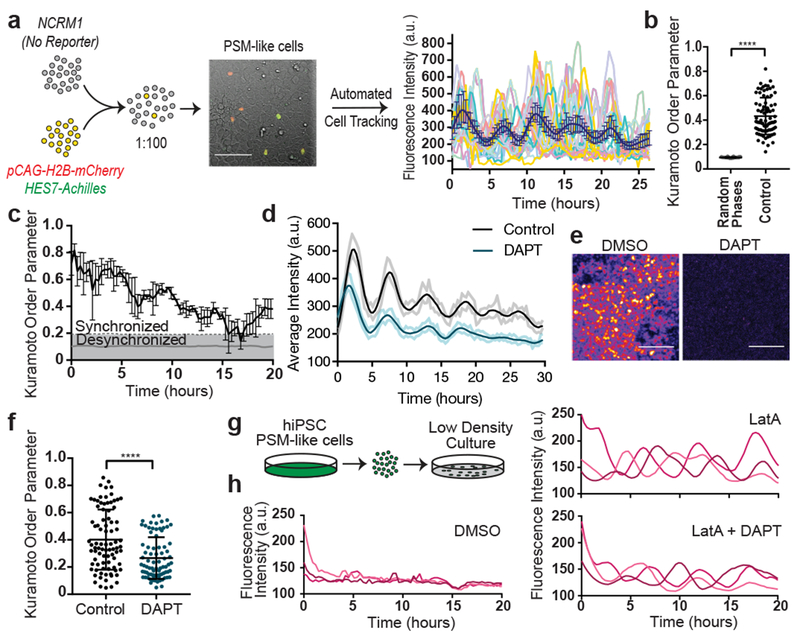
Figure 3. Synchronization of individual oscillators within human PSM cultures.
a, Experimental strategy for automated tracking of HES7-Achilles oscillations in individual cells. Scale bar = 100μm b, Kuramoto order parameter for HES7-Achilles cells vs. the same dataset with randomized phases. Mean ±SD. Paired two-sided t-test p=5e−107. n=139 cells. c, Kuramoto order parameter timecourse of HES7-Achilles human PSM cells. Synchronization threshold shown as mean±SD of the Kuramoto order parameter for same dataset, but with randomized phases. n=139 cells d, Average intensity profiles for individual HES7-Achilles human PSM cells treated with vehicle control (DMSO) or 25μM DAPT. Mean ± 95% CI. n=152 cells (Control), 106 cells (DAPT). e, HES7-Achilles fluorescence in human PSM cells following treatment with DMSO or DAPT (25μM). n=9 independent experiments. Scale bar = 100μm f, Kuramoto order parameter for HES7-Achilles cells treated with DMSO or 25μM DAPT. Mean ±SD. Paired two-sided t-test p=2.6e−18. n=131 cells (Control), 110 cells (DAPT). g, Experimental strategy for analysis of oscillations in isolated human PSM cells. h, Representative HES7-Achilles intensity profiles for three isolated human PSM cells in medium containing DMSO, 350nM LatA, or 350nM LatA in combination with 25μM DAPT. n=5 independent experiments.

