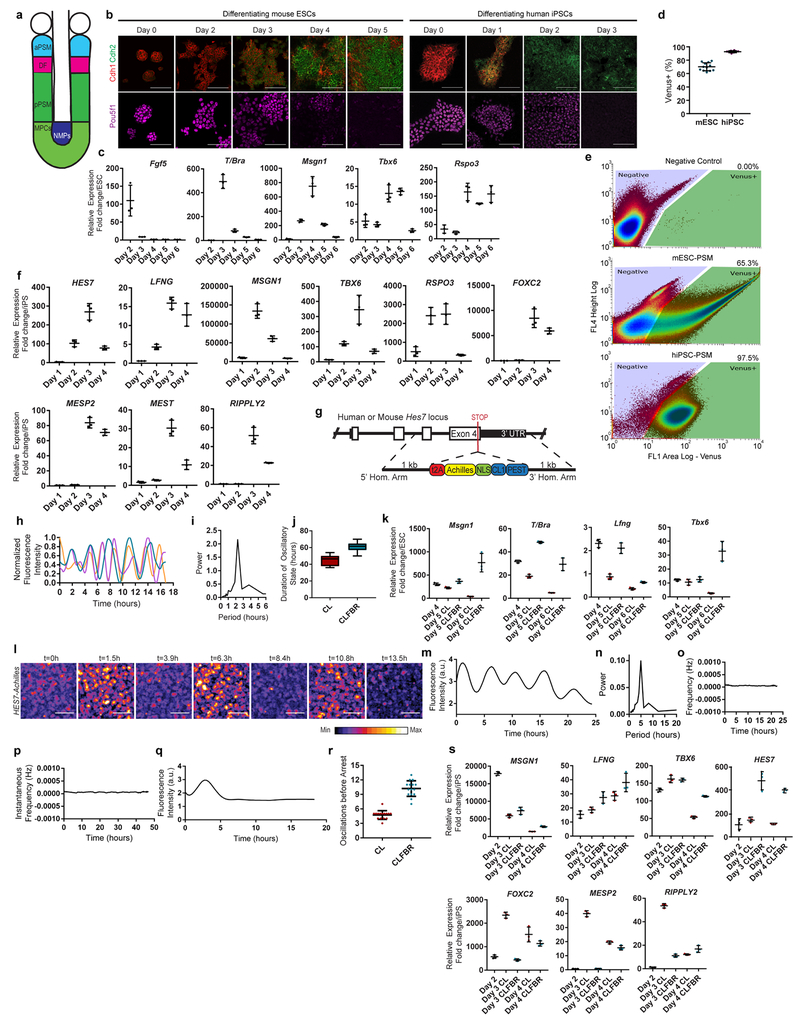
Extended data Figure 1.
a, Scheme illustrating the maturation stages of paraxial mesoderm. aPSM, anterior PSM; DF, determination front; MPCs, mesodermal precursor cells; pPSM, posterior PSM; NMPs, neuromesodermal progenitors. b, Top: Immunofluorescence staining for the cadherins Cdh1 and Cdh2 (top), and the pluripotency factor Pou5f1 (bottom) in differentiating mESCs (left) and hiPSCs (right). n=4 independent experiments. Scale bar = 100 μm. c, qRT-PCR for the epiblast marker Fgf5, the NMP/mesodermal marker T/Bra, and the MPC/PSM markers Tbx6, Msgn1 and Rspo3 on days 2-6 of mESC differentiation. Relative expression shown as fold change relative to ESC (day 0). Mean ±SD. n=3 d, Percentage induction of the mESC pMsgn1-Venus reporter and the hiPSC MSGN1-Venus reporter as determined by FACS. Mean ±SD. n=12 (mESC), n=8 (hiPSC) e, Gating strategy and representative FACS plots for quantification of pMsgn1-Venus/MSGN1-Venus induction. f, qRT-PCR for cyclic genes (HES7, LFNG), posterior PSM markers (MSGN1, TBX6, RSPO3), determination front markers (MESP2, RIPPLY2), and anterior PSM markers (MEST, FOXC2) on days 1-4 of human iPSC differentiation. Relative expression shown as fold change relative to iPS (day 0). Mean ±SD. n=3 g, Diagram outlining the targeting strategy used to generate Hes7-Achilles/HES7-Achilles knock-in reporter lines in mouse ESCs and human iPSCs. h, Normalized Hes7-Achilles fluorescence intensity for three mESC-derived PSM cells imaged in CL medium on day 4 of differentiation. n=4 independent experiments i, Representative Fourier transform of Hes7-Achilles oscillations in mESC-derived PSM cells indicating the predominant period. n=19 cells j, Total time spent in the oscillatory state for Hes7-Achilles mESC-derived PSM cells cultured in CL or CLFBR medium from day 4 onwards. Middle hinge corresponds to median, lower and upper hinges correspond to 1st and 3rd quartiles, lower and upper whiskers correspond to minimum and maximum. n=8 (CL), n=12 (CLFBR) k, qRT-PCR comparing relative expression levels of Msgn1, Lfng, T/Bra and Tbx6 in mESC-derived PSM cells cultured in CL or CLFBR medium from day 4 onwards. Relative expression shown as fold change relative to ESC (day 0). Mean ± SD. n=3 l, Snapshots of HES7-Achilles fluorescence in human iPSC-derived PSM cells showing peaks and troughs over the course of 13.5 hours in CL medium on day 2 of differentiation. n=25 independent experiments. Scale bar = 100μm m, Representative quantification of HES7-Achilles fluorescence intensity in a small region of interest from day 2 to day 3 of human iPSC differentiation. n=25 independent experiments n, Representative Fourier transform of HES7-Achilles oscillations indicating the predominant period in day 2 human iPSC-derived PSM cells in CL medium. n=25 independent experiments o, Representative instantaneous frequency in Hertz (calculated by Hilbert transformation) of HES7-Achilles oscillations in human iPSC-derived PSM cells from day 2 to day 3 of differentiation in CL medium. n=25 independent experiments p, Representative instantaneous frequency in Hertz (calculated by Hilbert transformation) of HES7-Achilles oscillations in human iPSC-derived PSM cells from day 2 to day 3 of differentiation in CLFBR medium. n=33 independent experiments q, Quantification of HES7-Achilles fluorescence in human iPSCs differentiated for 48 hours without the BMP inhibitor LDN93189 (CHIR99021 only medium). n=3 independent experiments r, Total number of HES7-Achilles oscillations for human iPSC-derived PSM cells cultured in CL or CLFBR medium from day 2 onwards. Mean ±SD. n=15 s, qRT-PCR comparing relative expression levels of HES7, LFNG, TBX6 and MSGN1 in human iPSC-derived PSM cells cultured in CL or CLFBR medium from day 2 onwards. Relative expression shown as fold change relative to iPS (day 0). Mean ± SD. n=3

