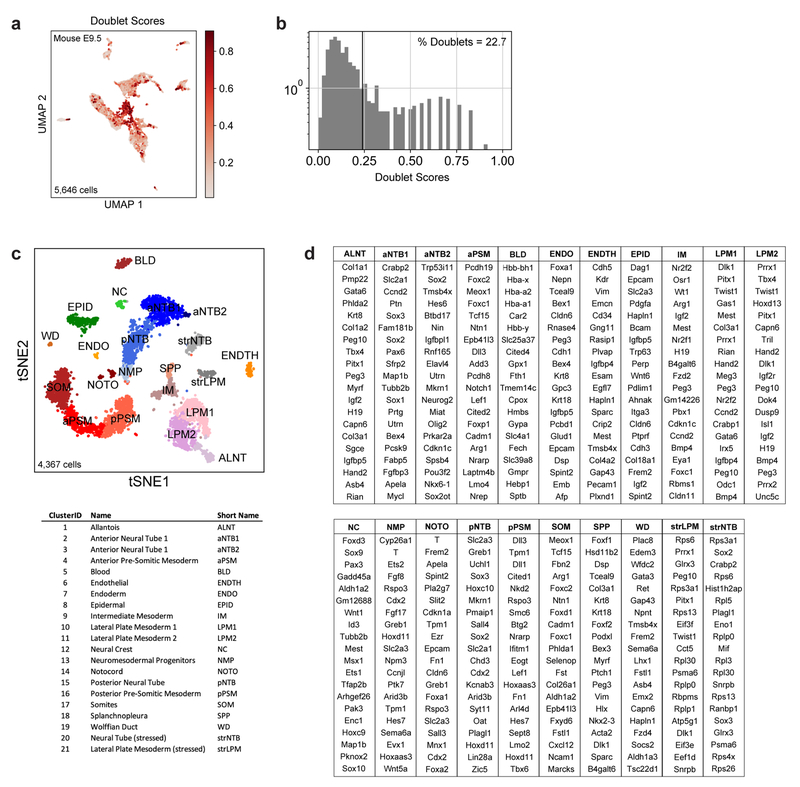
Extended Data Figure 2.
a, Pre-filtering of doublet-like cells. UMAP embedding shows all original E9.5 cells (n=5,646), colored by doublet score. Doublet scores indicate the extent to which a given single-cell transcriptome resembles a linear combination of two randomly selected cells (see Wolock et al 2019 and Methods). b, Histogram of doublet scores. Scores >0.24 were filtered from subsequent analyses. c, tSNE embedding of E9.5 cells (n=4,367) post-doublet filtering. Individual cells are colored according to annotated Louvain cluster IDs. d, Top 20 positively enriched transcripts for each Louvain cluster relative to all other clusters, as detected by a two-sided Wilcoxon rank-sum test. Reported transcripts are ranked by FDR-corrected p-values (Benjamini-Hochberg). For exact sample sizes, see Extended Data Table 1.

