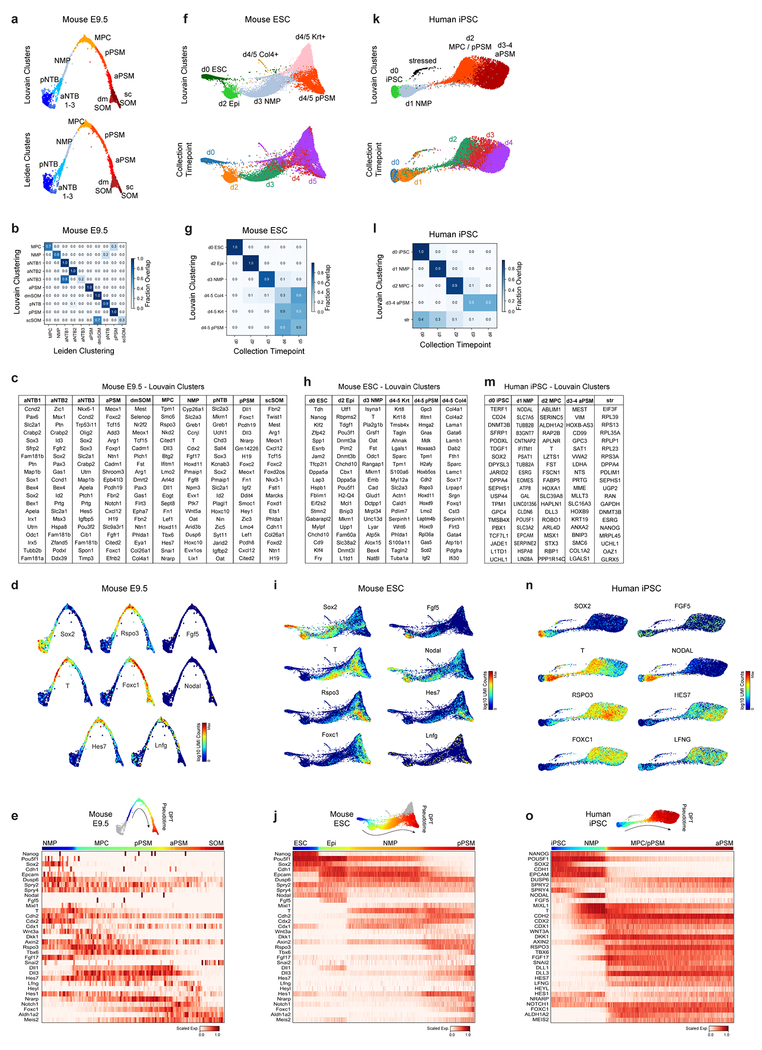
Extended Data Figure 3.
a,f,k, ForceAtlas2 layouts of mouse E9.5 embryos, mESC, and hiPSC single-cell kNN graphs, colored by cluster ID and collection timepoints as indicated. b,g,l, Confusion matrix plots overlap of cluster and timepoint assignments, row normalized. c,h,m, Top 20 positively enriched transcripts for Louvain clusters relative to all other clusters in each dataset, as detected by a two-sided Wilcoxon rank-sum test. Reported transcripts are ranked by FDR-corrected p-values (Benjamini-Hochberg). For exact sample sizes, see Extended Data Table 1. d,i,n, ForceAtlas2 layouts of single-cell kNN graphs, overlaid with log-normalized transcript counts for indicated genes. e,j,o, Top, colors indicate pseudo-temporal orderings. Bottom, heatmap of selected markers of paraxial mesoderm differentiation. Approximate locations of cluster centers are indicated.

