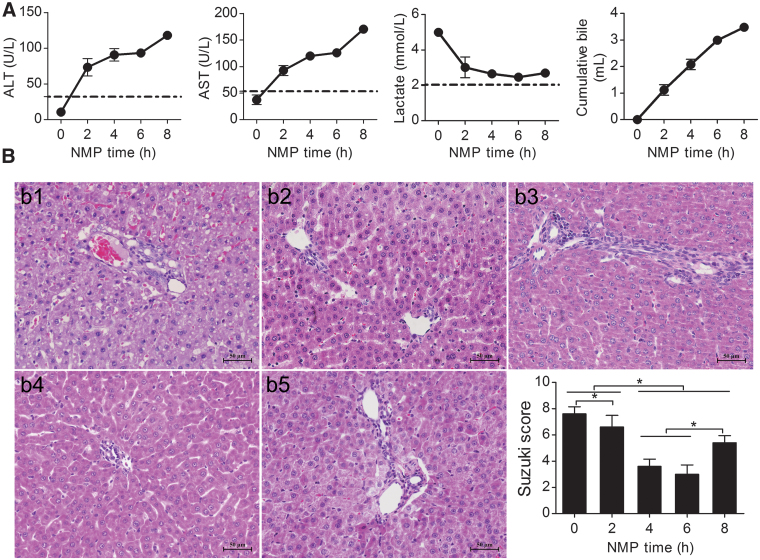
FIG. 3.
Rat NMP system evaluation. (A) ALT, AST, lactate clearance, and bile production. ALT and AST showed increasing trends that gradually slowed down. After 6 h of perfusion, ALT and AST increased significantly and were significantly different among the time points, except for hours 4 and 6. Lactate gradually decreased and showed an increasing trend after hour 6; lactate at hour 6 was significantly lower than that at hour 2. The bile level gradually increased, and the amplitude of bile secretion decreased after 6 h of perfusion (n = 5). (B) DCD liver pathology and Suzuki's scores: HE-stained liver at (b1) the instant of perfusion, (b2) hour 2 after perfusion, (b3) hour 4 after perfusion, (b4) hour 6 after perfusion, and (b5) hour 8 after perfusion. Liver pathology was best at hour 4 and 6; hepatocyte edema, eosinophilic degeneration, and hepatocyte necrosis were observed at hour 8 (scale bar = 50 μm, n = 5). *P < 0.05. ALT, alanine aminotransferase; AST, aspartate aminotransferase; HE; hematoxylin and eosin.

