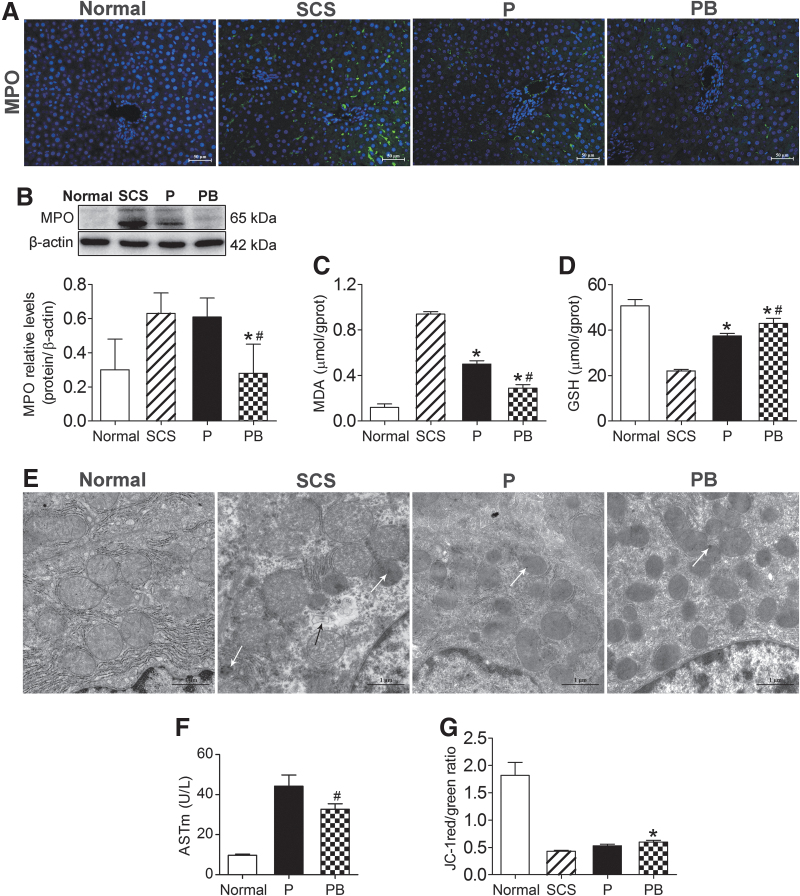
FIG. 5.
BMMSCs improved DCD liver oxidative stress, and repaired mitochondrial damage and function. (A) Immunofluorescence staining of MPO. Green indicates MPO; blue indicates DAPI-stained nuclei (scale bar = 50 μm, n = 5). (B) Western blotting and quantitative analysis of MPO. The level of MPO in the PB group was significantly lower than that in the P and SCS groups (Normal group: 0.30 ± 0.18, SCS group: 0.63 ± 0.12, P group: 0.61 ± 0.11, PB group: 0.28 ± 0.17, n = 5). (C) MDA levels (Normal group: 0.12 ± 0.03 μmol/g prot, SCS group: 0.94 ± 0.02 μmol/g prot, P group: 0.50 ± 0.03 μmol/g prot, PB group: 0.29 ± 0.03 μmol/g prot, n = 5). (D) GSH levels (Normal group: 50.64 ± 2.74 μmol/g prot, SCS group: 22.06 ± 0.63 μmol/g prot, P group: 37.38 ± 1.09 μmol/g prot, PB group: 42.91 ± 2.22 μmol/g prot, n = 5). (E) Mitochondrial ultrastructure in DCD livers. The SCS group showed more severe mitochondrial edema, vacuolization, irreversible damage (white arrows, flocculated density), and partial mitochondrial lysis (black arrows). Mitochondrial cristae were disrupted (almost disappeared) in the SCS liver. The PB group and P group showed almost no mitochondrial edema, vacuolization, and there was less irreversible damage. Mitochondrial cristae were intact (scale bar = 1 μm). (F) ASTm levels in perfusate (Normal group: 9.68 ± 0.66 U/L, P group: 44.28 ± 5.50 U/L, PB group: 32.78 ± 2.68 U/L, n = 5). (G) Mitochondrial JC-1 membrane potential levels in liver tissue (Normal group: 1.82 ± 0.24, SCS group: 0.43 ± 0.02, P group: 0.53 ± 0.03, PB group: 0.60 ± 0.03, n = 5). *P < 0.05 versus SCS group, #P < 0.05 versus P group. ASTm, mitochondrial AST; GSH, glutathione; MDA, malondialdehyde; MPO, myeloperoxidase; P, NMP; PB, NMP combined with BMMSCs.

