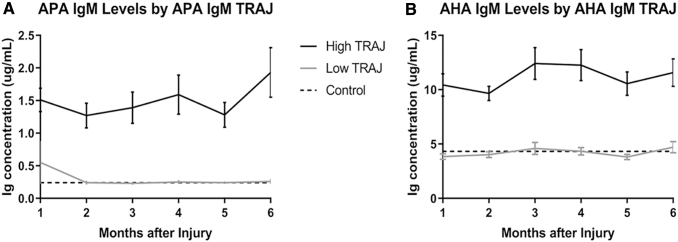
FIG. 8.
Immunoglobulin (Ig) levels by group-based trajectory analysis (TRAJ) group membership. (A) IgM anti-pituitary antibody (APA) and (B) anti-hypothalamic antibody (AHA) levels were graphed by the generated TRAJ groups. There were significant differences in autoantibody levels by TRAJ groups for all autoantibodies (A and B, p < 0.05 all comparisons). Dashed lines represent mean control levels (APA IgM, 0.24 μg/mL and AHA IgM, 4.32 μg/mL).

