
. 2020 Apr 7;23(2):127–133. doi: 10.4103/aca.ACA_167_18
Copyright: © 2020 Annals of Cardiac Anaesthesia
This is an open access journal, and articles are distributed under the terms of the Creative Commons Attribution-NonCommercial-ShareAlike 4.0 License, which allows others to remix, tweak, and build upon the work non-commercially, as long as appropriate credit is given and the new creations are licensed under the identical terms.
Figure 2.
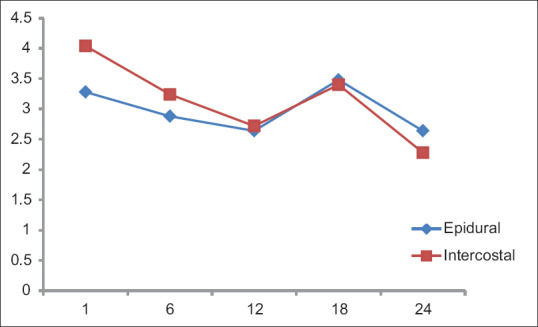
Sedation scale. X-axis: Time (h), Y-axis: Mean