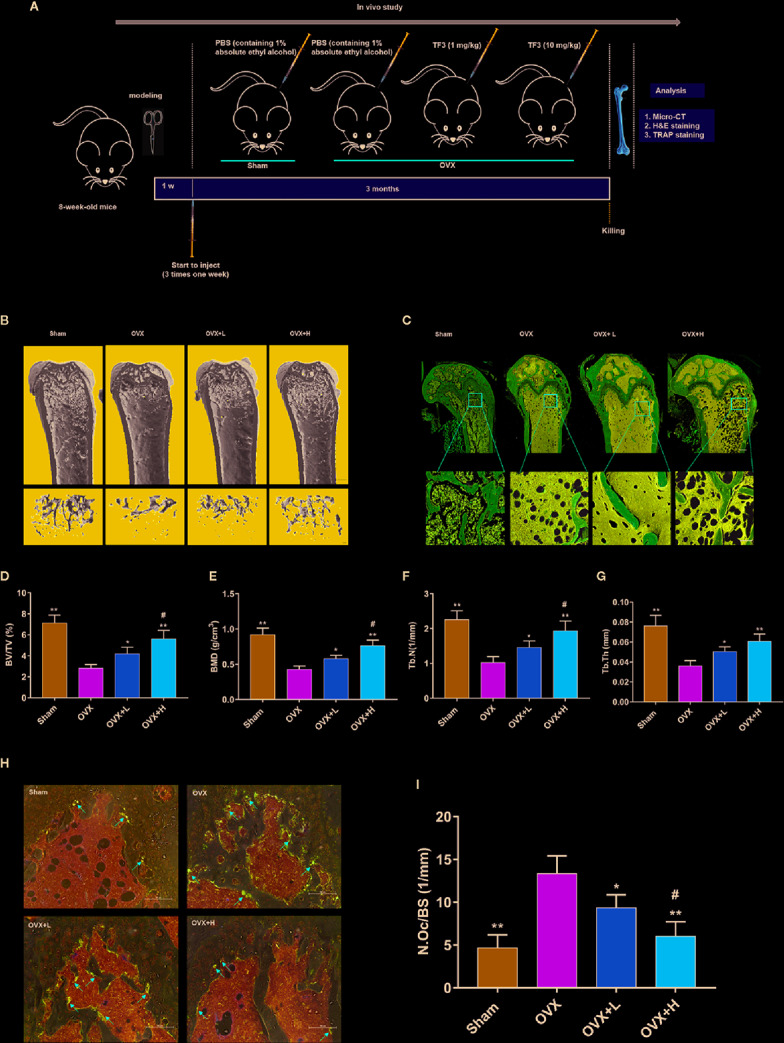
Figure 5.

TF3 prevented OVX-induced bone loss and osteoclast formation in vivo. (A) Schematic illustration of the establishment of the OVX mice model and the experimental design. (B) Representative micro-CT images displayed the effects of TF3 on bone loss. Scale bar = 1 mm. (C) Representative images of H&E staining of decalcified bone sections. Scale bar = 100 μm. (D–G) Quantitative analyses of parameters related to bone microstructure, including BV/TV, BMD, Tb.N, and Tb.Th. (H) Representative images of TRAP staining of decalcified bone sections. Scale bar = 100 μm. (I) Quantitative analyses of N.Oc/BS. n = 6, * P < 0.05, ** P < 0.01 compared with OVX group. # P < 0.05 compared with OVX + L group.
