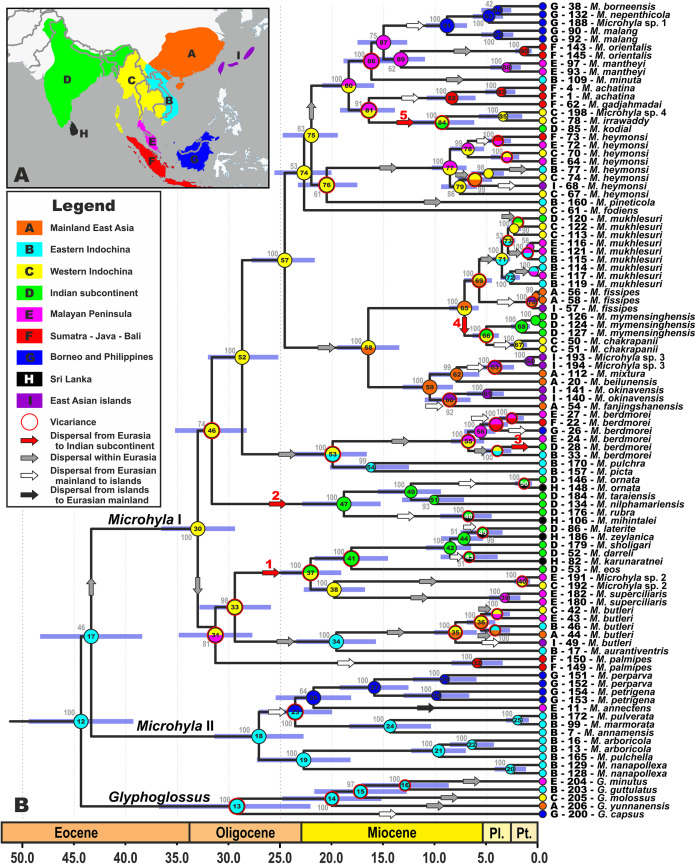
Figure 2. Biogeographic history of Microhyla.
(A) Biogeographic regions used in the present study; (B) BEAST chronogram on the base of 3207 bp-long mtDNA + nuDNA dataset with the results of ancestral area reconstruction in RASP. For biogeographic areas definitions, species occurrence data and transition matrices see Supplemental Information 1, Tables S5 and S6. Information at tree tips corresponds to biogeographic area code (see Fig. 2A), sample number (summarized in Table S1), and species name, respectively. Node colors correspond to the respective biogeographic areas; values inside node icons correspond to node numbers (see Fig. S3 and Table S11 for divergence time estimates); values near nodes indicate marginal probabilities for ancestral ranges (S-DIVA analysis); icons illustrate vicariant and dispersal events (see Legend). Red arrows from 1 to 5 correspond to the dispersals to the Indian Subcontinent by Microhyla II lineages. Base Map created using simplemappr.net.

