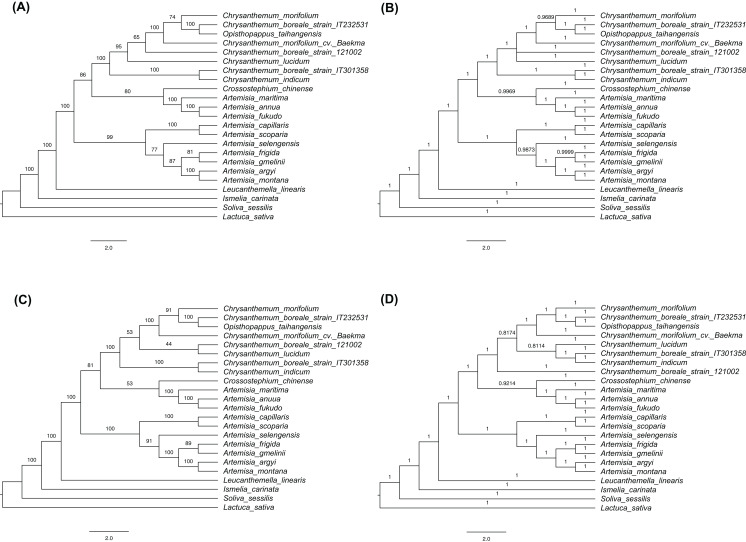
Figure 6. Cladograms using the maximum likelihood (ML) and Bayesian inference (BI) methods.
(A) ML tree based on the sequences of 77 shared protein-coding genes. (B) BI tree based on the sequences of 77 shared protein-coding genes. (C) ML tree based on the complete chloroplast genomes. (D) BI tree based on the complete chloroplast genomes. Numbers above the branches indicate bootstrap support values in ML trees and BI posterior probability in BI trees.

