Figure 4.

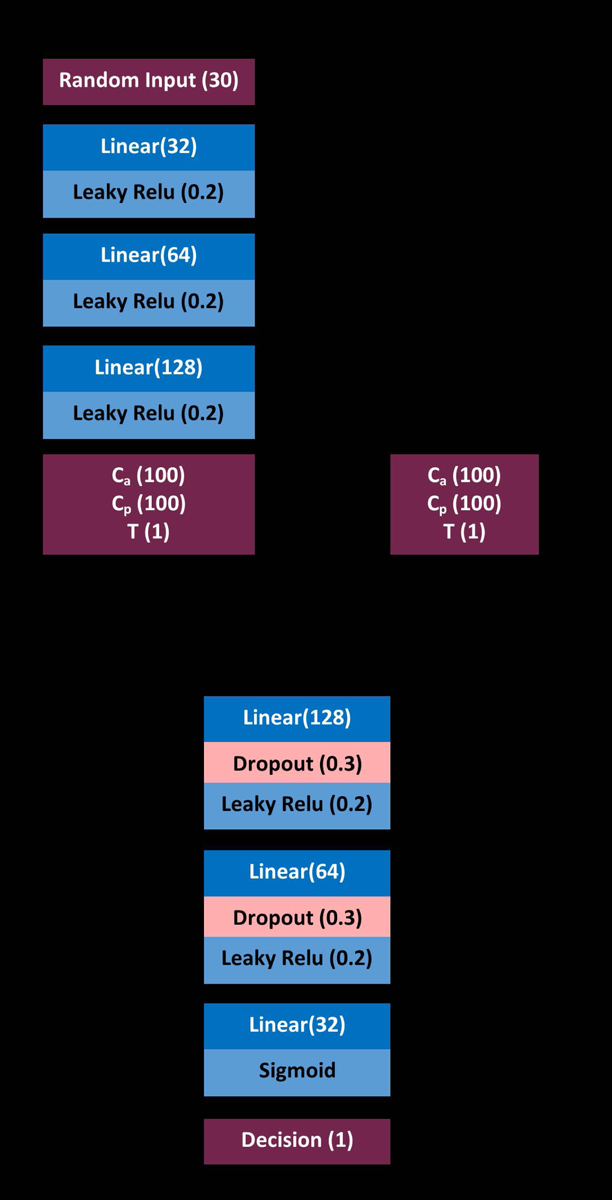
The design of the GAN used for generation of Ca and Cpv curves. Parenthetical values represent the dropout rate for dropout layers, the gradient of the leaky Relu, and the number of size for all other layers.

The design of the GAN used for generation of Ca and Cpv curves. Parenthetical values represent the dropout rate for dropout layers, the gradient of the leaky Relu, and the number of size for all other layers.