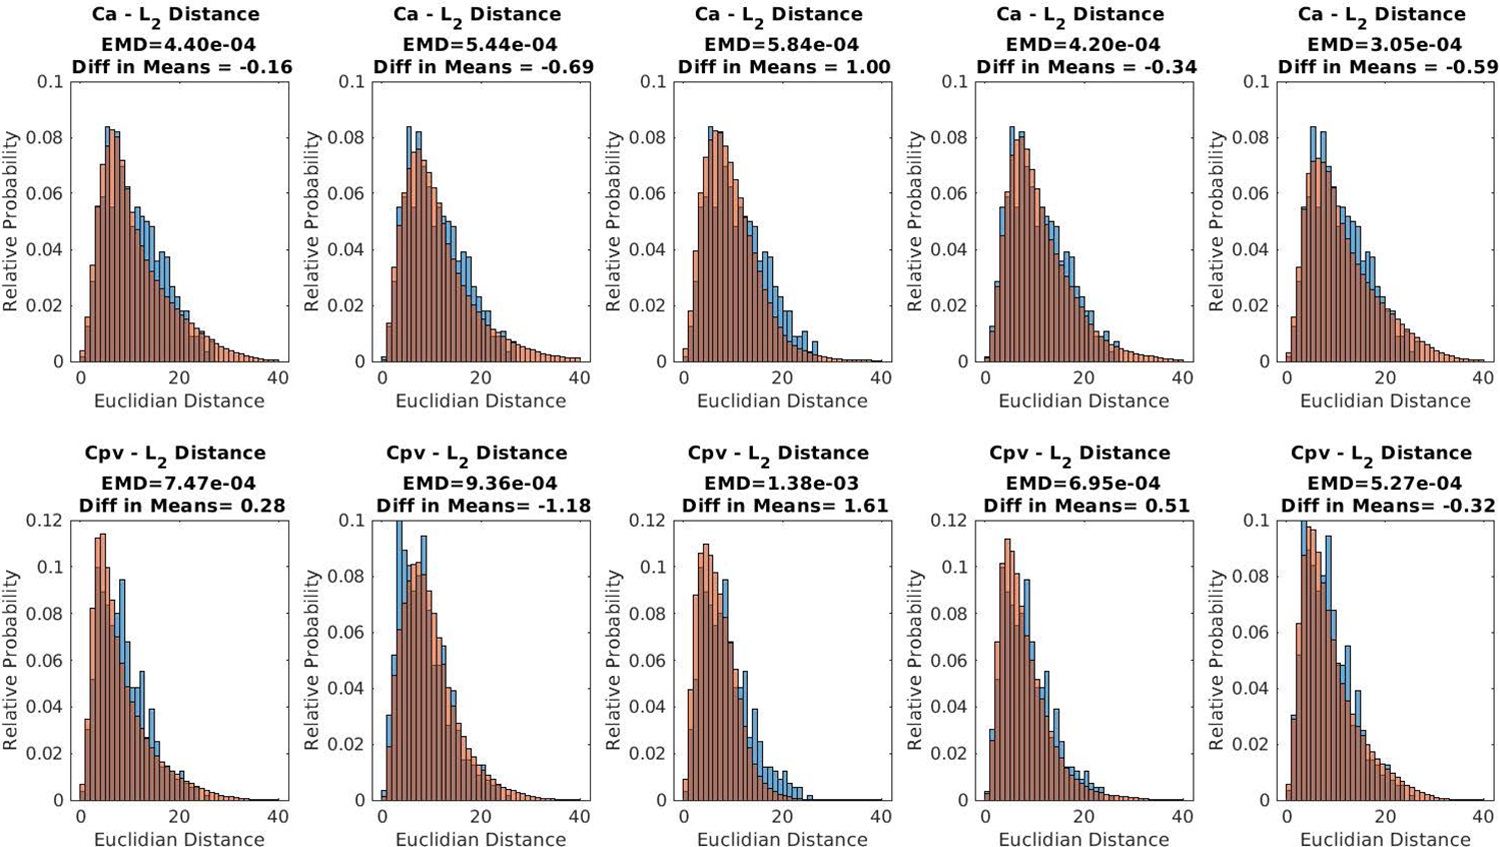
Figure 8.

For each of the 5 GANs used, the probability distributions for L2 norm of the distance between randomly selected Ca and Cpv curves for GAN generated data is shown in red. The probabilities for the measured data are shown in blue as reference.
