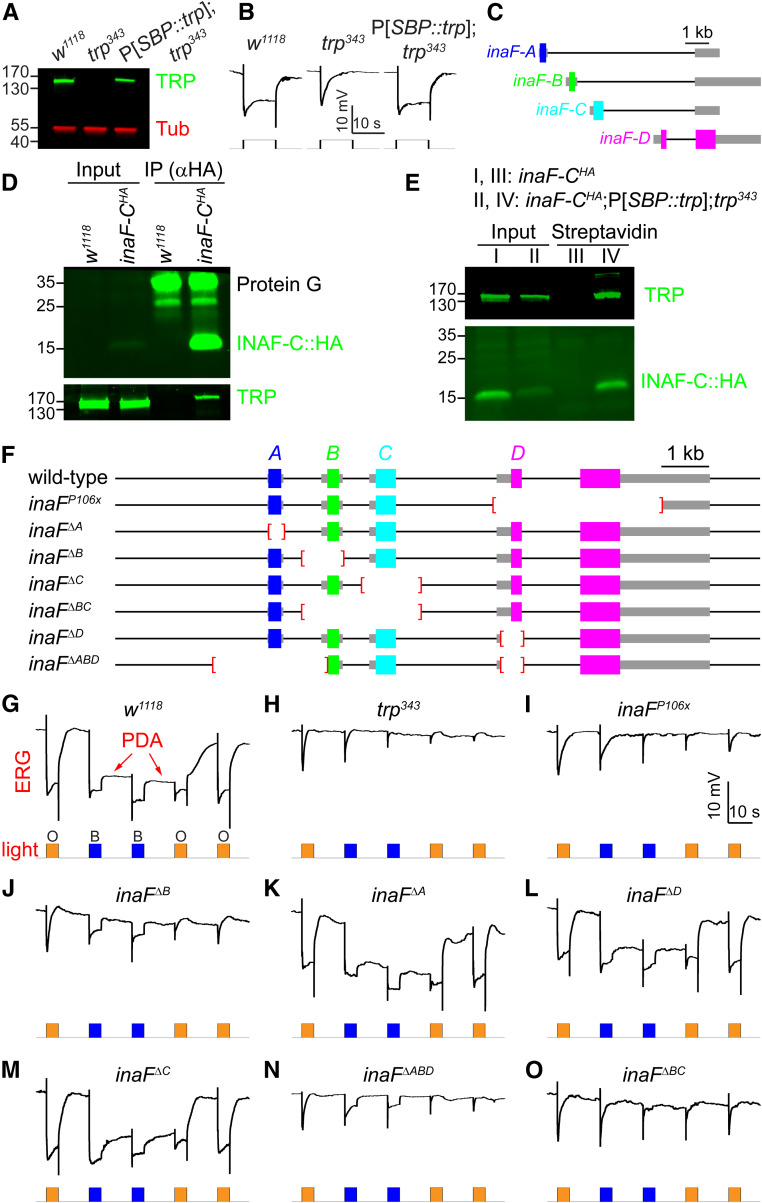
Figure 1.
INAF-C associates with TRP, and contributes to the light response. (A) Expression level of TRP in P[SBP::trp] transgenic flies. Western blot showing the expression levels of TRP in head extracts prepared from w1118 and P[SBP::trp];trp343 flies. The blot was probed with rabbit anti-TRP and mouse anti-tubulin (Tub). Protein size markers (kDa) are indicated. (B) Representative ERG responses to orange light using the indicated flies; n ≥ 5 for each genotype. Time and mV scale bars are presented. (C) The four inaF mRNAs encode distinct proteins: INAF-A, INAF-B, INAF-C, and INAF-D. The colored rectangles indicate the protein-coding regions, the thick gray lines represent untranslated regions, and the thin black lines indicate introns. A DNA scale bar is provided. (D) Co-IPs to assess whether TRP associates with INAF-C::HA. Anti-HA (mouse) was used to perform IPs using head extracts prepared from w1118 and inaF-CHA, which harbors an HA tag knocked into the C terminus of INAF-C. The IPs were fractionated by SDS-PAGE, and Western blots probed with rabbit anti-HA (top; recognizes INAF-C::HA) or rabbit anti-TRP (bottom) primary antibodies and LI-COR anti-rabbit IRDye 800CW secondary antibodies. The positions of protein size markers (kDa) are shown to the left. The rabbit anti-HA also reacted with Protein G, which was released from Protein G beads upon elution. (E) Pulldown assays to determine whether INAF-C associates with TRP. Head extracts were prepared from inaF-CHA and inaF-CHA;P[SBP::trp];trp343 flies, the latter of which expresses the SBP::trp transgene in a trp343 null background. Head extracts were incubated with streptavidin beads, and the eluted proteins (streptavidin lanes) were fractionated by SDS-PAGE. The Western blots were probed with rabbit anti-TRP (top) and rabbit anti-HA (bottom) to identify TRP and INAF-C::HA, respectively. The input represents 4% of the extracts offered in the assays (D and E), and protein size markers (kDa) are shown to the left. (F) Wild-type inaF and inaF mutant alleles. Deletions are indicated by red brackets. (G–O) Representative ERG responses from the indicated genotypes (n ≥ 5 for each). A prolonged depolarizing afterpotential (PDA) is indicated in (G). Orange (O) and blue light (B) stimuli (5 sec/pulse) are indicated. Time and mV scales are indicated.

