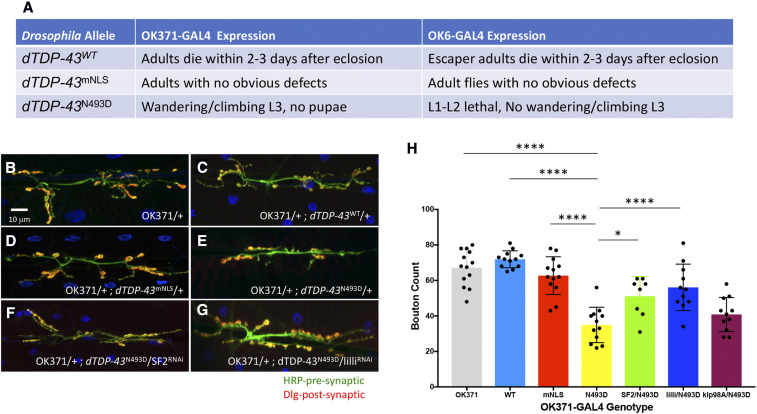
Figure 5.
Modifier effects on dTDP-43 transgenic construct expression in the NMJ. (A) Table summarizing the observed phenotypes using two different GAL4 motor neuron drivers (OK371-GAL4 and OK6-GAL4) to direct expression of the following UAS containing transgenic constructs inserted into the ZH-86Fb attB third chromosome insertion site: dTDP-43WT, dTDP-43mNLS, and dTDP-43N493D. (B–G) Qualitative morphological effects on larval NMJs of the following genotypes: (B) OK371-GAL4, (C) OK371-GAL4/+; UAS-dTDP-43WT, (D) OK371-GAL4/+; UAS-dTDP-43mNLS/+, (E) OK371-GAL4/+; UAS-dTDP-43N493D/+, (F) OK371-GAL4/+; UAS-dTDP-43N493D/SF232367, and (G) OK371-GAL4/+; UAS-dTDP-43N493D/lilli26314. (H) Histogram representation of the quantification of the average bouton numbers per muscle in individuals from B–G. All genotypes listed are in an OK371-GAL4/+ background: OK371 are control OK-371-GAL4 heterozygous individuals (gray), WT (light blue), mNLS (red), and N493D (yellow) correspond to the dTDP-43 transgenic constructs, while SF2/N493D (green), lilli/N493D (blue), and klp98A/N493D (magenta) correspond to the SF232367, lilli26314, and klp98Ac05668 alleles in the background OK371-GAL4/+; UAS-dTDP-43N493D. The dTDP-43N493D strain displayed significant differences in NMJ bouton counts when compared to OK371-GAL4 (**** P < 0.001), OK371-GAL4/+; UAS-dTDP-43WT (**** P < 0.001), and OK371-GAL4/+; UAS-dTDP-43mNLS (**** P < 0.001). dTDP-43mNLS and dTDP-43WT bouton numbers were not significantly different from dTDP-43WT. SF2 (* P < 0.0031) and lilli (**** P < 0.001) alleles caused substantial improvement of NMJ morphology in comparison to OK371-dTDP-43N493D, while klp98A did not. Quantifications were done manually at the confocal microscope and statistical significance was determined by using an unpaired parametric t-test with Prism software. NMJ preparations were stained with anti-HRP (green) and anti-discs large (Dlg) (red) to mark pre- and postsynaptic structures, respectively, and muscle nuclei were labeled with DAPI. The asterisks above the lines correspond to the degree of significance between the denoted genotypes. The more asterisks, the smaller the P-value.

