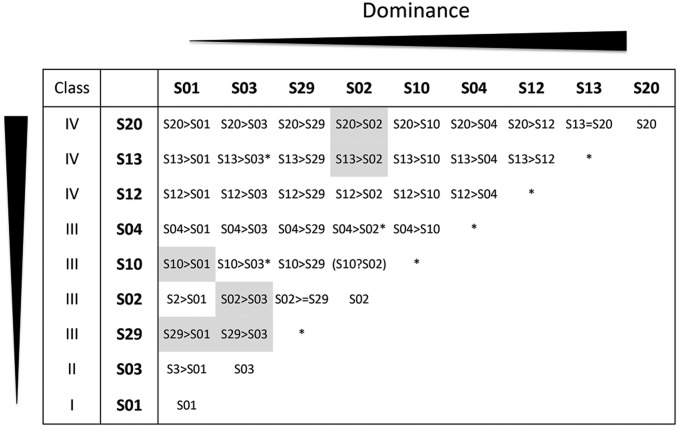
Figure 1.
Pairwise dominance interactions in pollen between the nine A. halleri S-alleles included in this study. Gray-shaded cells indicate pairwise dominance interactions inferred from phylogenetic classes rather than directly determined phenotypically. Star symbols indicate genotypes that were not available for the transcriptional analysis. Genotype S10S02 is shown in parentheses with a question mark to indicate that this dominance relationship is currently not known experimentally, and cannot be determined from the phylogeny because these two alleles belong to the same phylogenetic class (shown on the left side of the figure). The possibly unusual dominance interaction between S02 and S29 is indicated by the symbol “>=” (see text for details). Details of the crosses and references for the raw phenotypic data used in this figure are reported in Table S3.

