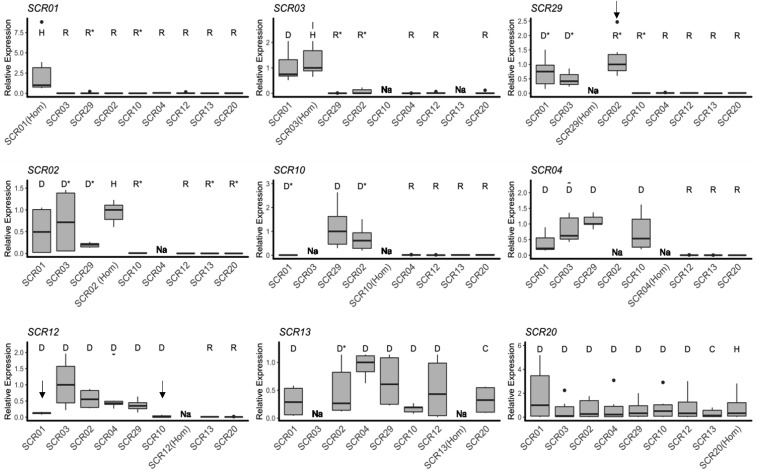
Figure 3.
Expression of individual SCR alleles in different genotypic contexts. Pollen dominance statuses of the S-allele whose expression is measured relative to the other allele in the genotype as determined by controlled crosses are represented by different letters (D: dominant; C: codominant; R: recessive; U: unknown; and H: Homozygote; Table S3). In a few instances, relative dominance statuses of the two alleles had not been resolved phenotypically and were inferred from the phylogeny (marked by asterisks). Thick horizontal bars represent the median of 2−ΔCt values, first and third quartiles are indicated by the upper and lower limits of the boxes. The upper whisker extends from the hinge to the largest value no further than 1.5 x interquartile range from the hinge (or distance between the first and third quartiles). The lower whisker extends from the hinge to the smallest value at most 1.5 x interquartile range of the hinge and the black dots represents outlier values. We normalized values relative to the highest median across heterozygous combinations within each panel. Alleles are ordered from left to right and from top to bottom according to their position along the dominance hierarchy, with SCR01 the most recessive and SCR13 and SCR20 the most dominant alleles. Under a model of transcriptional control of dominance, high expression is expected when a given allele is either dominant or codominant, and low expression when it is recessive. Exceptions to this model are marked by black vertical arrows and discussed in the text. “Na” marks genotypes that were not available.

