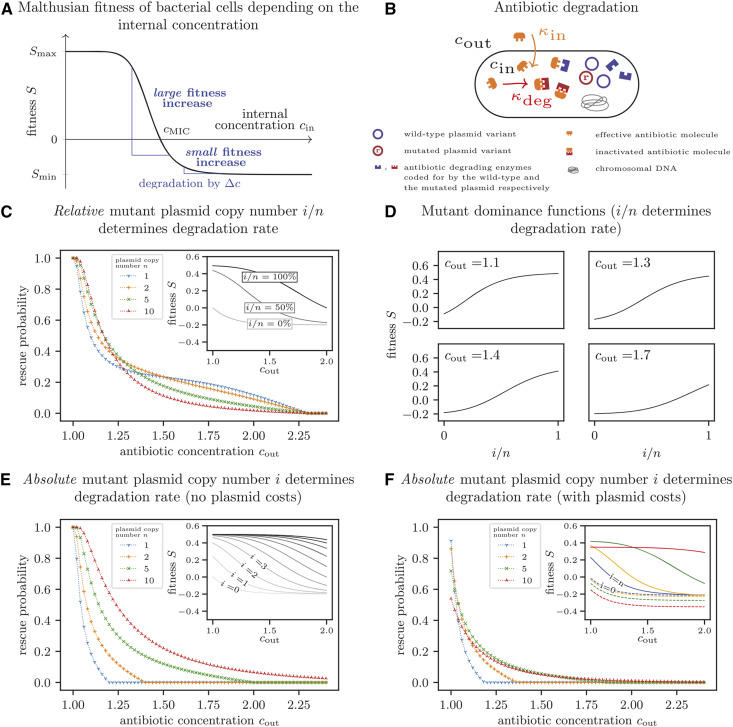
Figure 3.
Dependence of the optimal plasmid copy number on the antibiotic concentration. (A) Malthusian fitness S of a bacterial cell as a function of the antibiotic concentration within the cell. (B) Illustration of a simple model to determine the antibiotic concentration within the cell. Antibiotic molecules diffuse into the cell, where they become inactivated due to reactions with the mutant version of a plasmid-encoded enzyme. We assume that inflow of antibiotic molecules kin and degradation kdeg are in equilibrium. (C) Probability of evolutionary rescue if the relative number of mutant plasmids within the cell determines the degradation rate. The enzyme production increases linearly with the relative number of mutated plasmid copies, and the cell fitness is thus determined by the fraction i/n of mutated plasmids within the cell (inset). (D) Mutant dominance functions for various antibiotic concentrations if the relative number of mutant plasmids i/n within a cell determines the degradation rate. With increasing concentration, the shape changes from concave to convex. (E) Probability of evolutionary rescue if the absolute number of mutant plasmids within the cell determines the degradation rate. The enzyme production increases linearly with the absolute number of mutated plasmid copies, corresponding to a gene dosage effect (see inset for the concentration-dependent fitness of each cell type). Rescue probabilities increase with higher plasmid copy numbers. (F) Probability of evolutionary rescue if the absolute number of mutant plasmids within the cell determines the degradation rate and plasmids impose a copy-number-dependent cost. Unlike in (E), plasmid costs increase bacterial death rates by c = 0.015 per plasmid copy. For very low antibiotic concentrations, the probability is lowest for high copy numbers due to the high associated costs. For high concentrations, the disadvantage of a higher burden is outweighed by the advantage of more efficient antibiotic degradation, and the rescue probability increases with the copy number. In the inset of (F), dashed and solid lines show the fitness of wild-type and mutant homozygous cells, respectively. Results for the rescue probabilities were obtained as in Figure 2. The fitnesses are calculated from Equation (B.1) and Equation (B.7) with either Equation (B.4) (for C and D) or Equation (B.5) (for E and F). Parameters:

