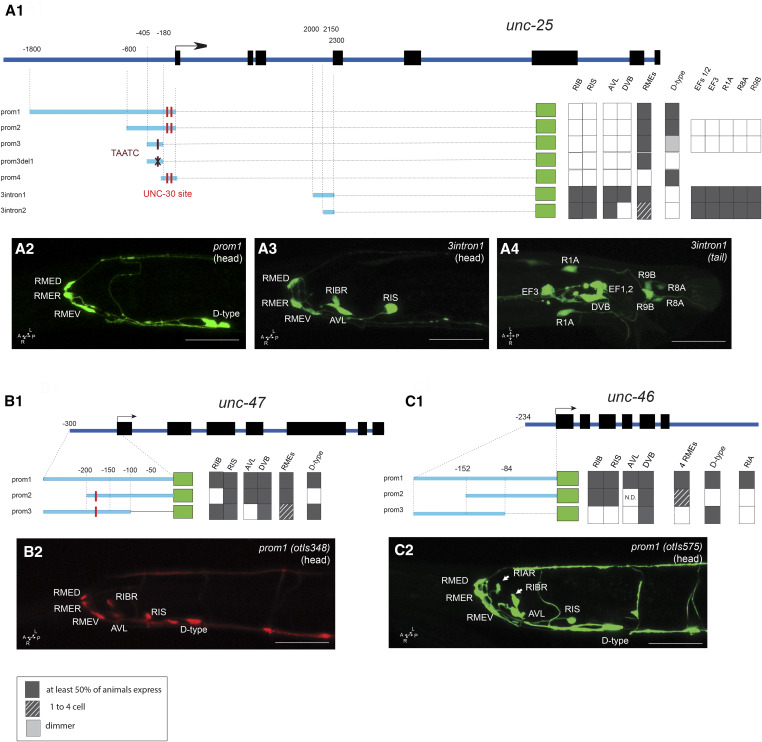
Figure 7.
Analysis of cis-regulatory elements of GABA pathway genes. Analysis of the unc-25/GAD (A1), unc-47/VGAT (B1), and unc-46/LAMPG (C1) loci. (A1, B1, and C1) Schematic of the unc-47, unc-25, and unc-46 GABA pathway genes. The constructs are referred to their respective loci to scale. Dark gray boxes indicate that in at least two lines, > 50% of the worms show gfp expression in the cell. Dashed lined color indicates that, in at least two lines, > 50% of the worms had gfp expression in at least one RME (if there are no dashed lines, gfp expression is always present in the four RMEs). The black cross indicates the position of the deletion in unc-25prom3del1 (TAATC). The red line indicates the position of the UNC-30-binding site sequence (TAATCC). Note that there is no TAATCC sequence in the unc-46 promoter. (A2, A3, A4, B2, and C2) Representative confocal images of adult animals for unc-25prom1 head (A2), unc-25_3intron1 [head (A3) and tail (A4)], unc-47prom1 head (B2), and unc-46prom1 head (C2). Usually two or three lines were scored for each reporter and > 10 animals/line. Bar, 50 μm. GABA, γ-aminobutyric acid.

