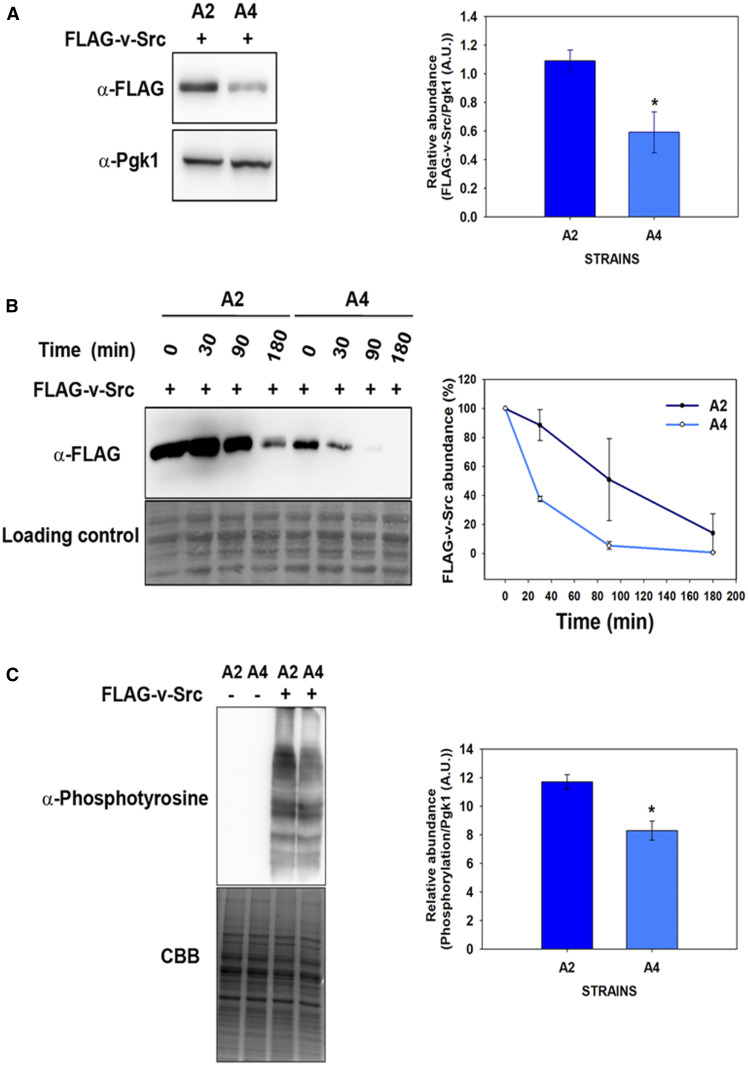
Figure 2 .
v-Src activity and its degradation in the A4 and A2 strains. (A) v-Src expression was induced for 12 hr, and its abundance was monitored in cellular lysate with the anti-FLAG antibody. (B) v-Src expression was induced for 12 hr in SGal media. Cells were then shifted to noninducible SD liquid media and v-Src abundance was chased at the indicated time intervals with anti-FLAG antibody. (C) Equal amounts of cellular lysate from the A2 or A4 strains expressing v-Src were probed with anti-phosphotyrosine antibody. Panel toward right depicts quantification of respective immunoblots. Error bars represents SD from three different biological replicates. P-values were calculated using the Student’s t-test and A2 as a control. A.U., arbitrary units; SGal, SD media supplemented with 2% raffinose, 2% galactose and 2% dextrose respectively.

