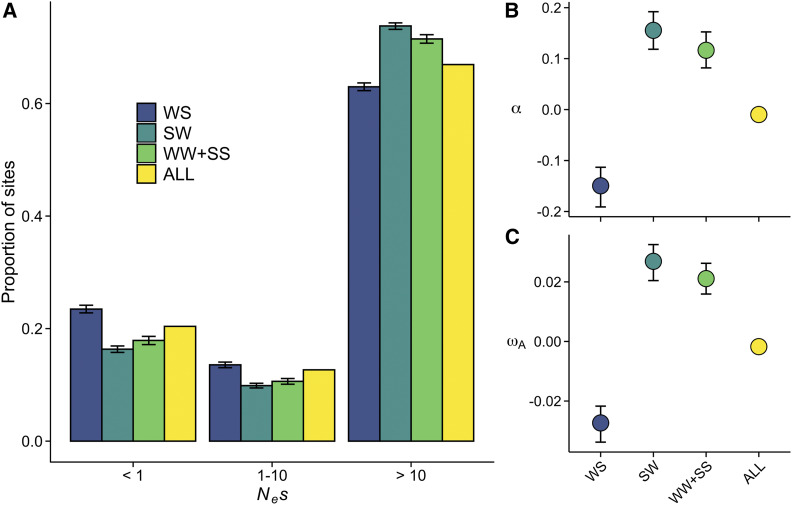
Figure 3.
Apparent strength of negative and positive selection in A. thaliana (n = 645). (A) The distribution of fitness effects (DFE). Nonsynonymous sites were divided into three bins based on the strength of purifying selection (Nes): nearly neutral, intermediate, and highly deleterious, respectively. (B) The proportion of sites fixed by positive selection (α). (C) The rate of adaptive substitutions relative to the neutral mutation rate (ωA). For all three figures, error bars show 95% CIs (CIs are too narrow to show for ALL-sites).

