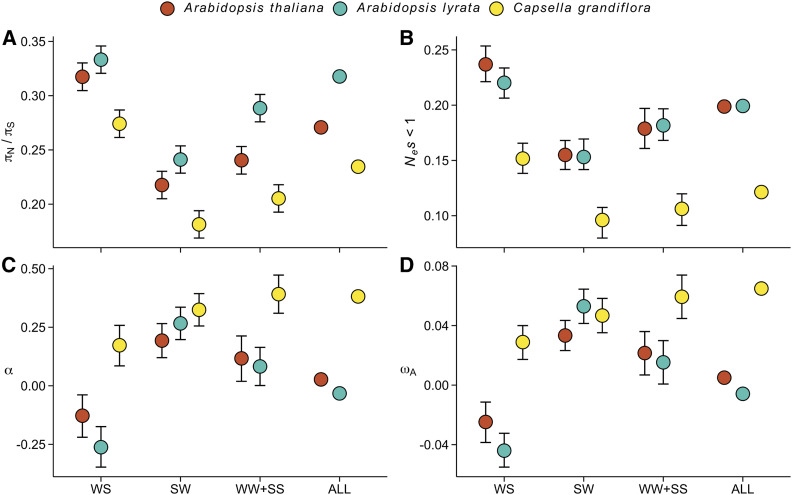
Figure 4.
The effect of gBGC on measures of protein evolution in three Brassicaceae species. Analyses were conducted using the same number of chromosomes (n = 42) from each species. (A) The ratio of nonsynonymous to synonymous nucleotide diversities (πN/πS). (B) The proportion of nearly neutral mutations (Nes < 1). (C) The proportion of sites fixed by positive selection (α). (D) The rate of adaptive substitutions relative to the neutral mutation rate (ωA). For all four figures, error bars show 95% CIs.

