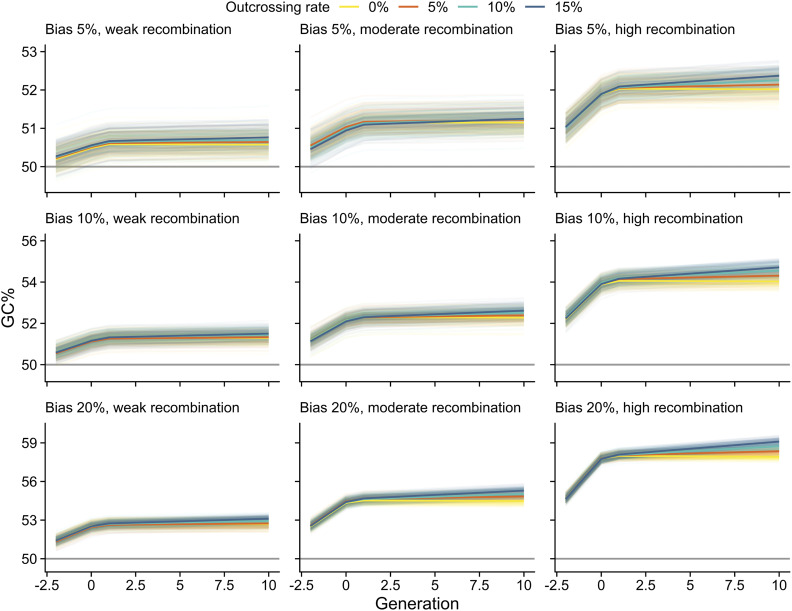
Figure 6.
The simulated extent of GC% under gBGC. Time in number of generations is shown in the horizontal axes (×104 scaled, ×105 unscaled). At time zero, population switches from full outcrossing to predominant selfing. GC% estimates are shown for three levels of GC over AT repair bias, three recombination rates, and four outcrossing rates. Solid colors show average estimates. Results from each of 100 simulations are shown in transparent colors. Gray horizontal lines mark the expected estimates in the absence of gBGC.

