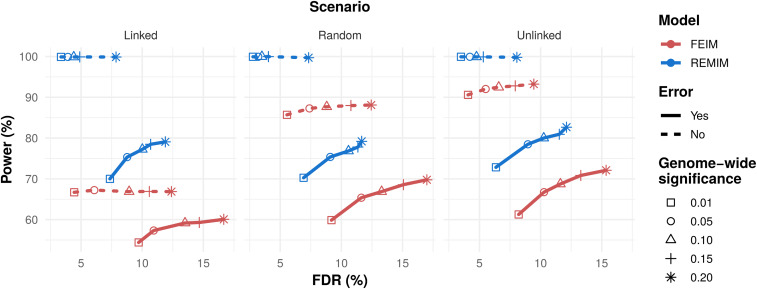
Figure 2.
Detection power (in percentage) vs. empirical false discovery rate (FDR, in percentage) from QTL mapping analyses of simulated traits in ‘Beauregard’ × ‘Tanzania’ (BT) full-sib family. Each trait was simulated with three QTL with different heritabilities positioned along the BT linkage map (n = 298). At least two out of three QTL were linked or not depending on three scenarios (linked, random, and unlinked), with 1000 simulations each scenario. Fixed-effect interval mapping (FEIM, red) and random-effect multiple interval mapping (REMIM, blue) were carried out with (solid lines) and without (dotted lines) the simulated error. FEIM and REMIM used different genome-wide significance thresholds (, symbols) based on permutation tests or resampling method, respectively. For a ∼95% support interval coverage, power was computed as the proportion of true QTL over the total number of simulated QTL, and FDR as the proportion of false QTL over the total number of mapped QTL.

