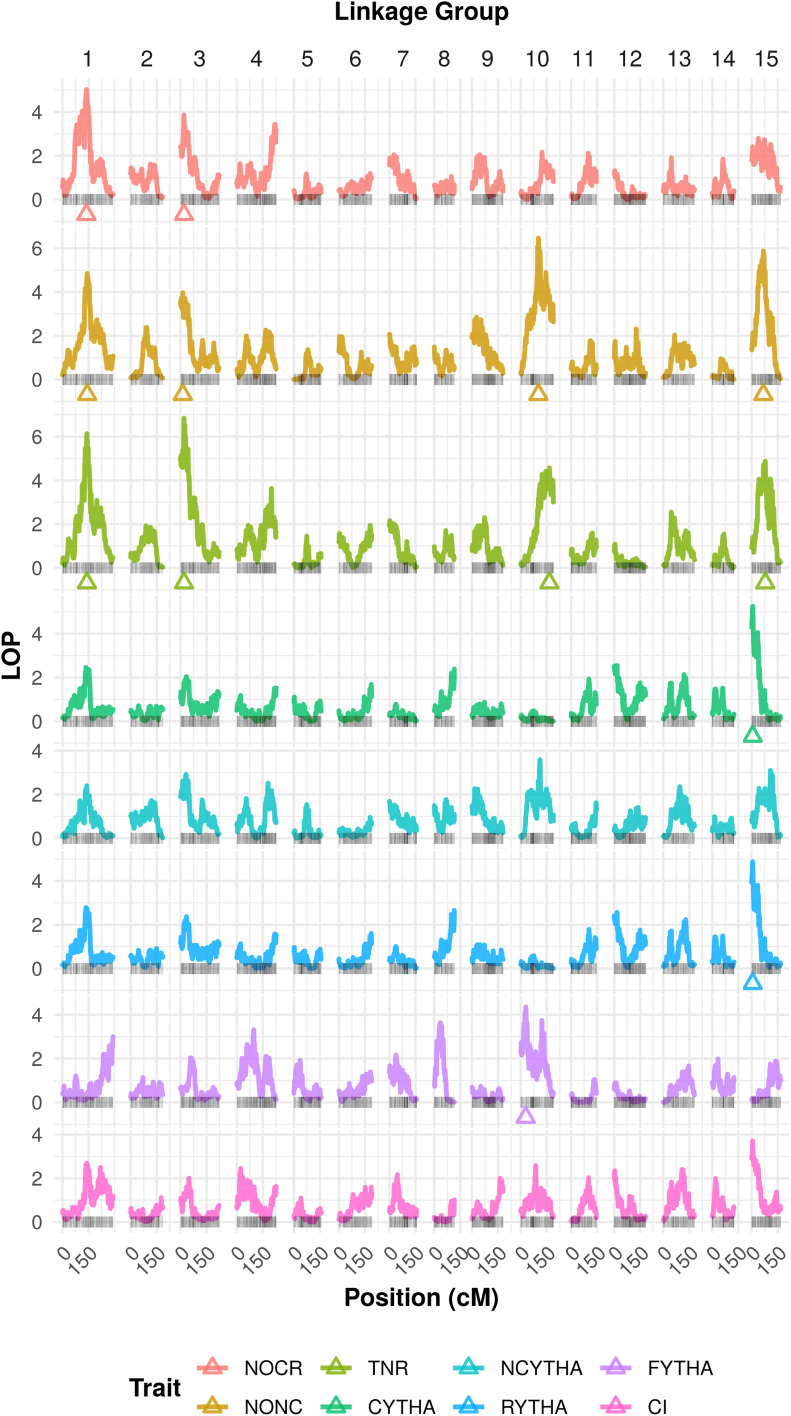
Figure 3.
Logarithm of P-value (LOP) profiles from random-effect multiple interval mapping (REMIM) of eight yield-related traits from ‘Beauregard’ × ‘Tanzania’ (BT) full-sib family. Triangles show the QTL peak location. Trait abbreviations: number of commercial (NOCR), noncommercial (NONC), and total (TNR) roots per plant, commercial (CYTHA), noncommercial (NCYTHA) and total (RYTHA) root yield in t ha−1, foliage yield (FYTHA) in t ha−1, and commercial index (CI).

