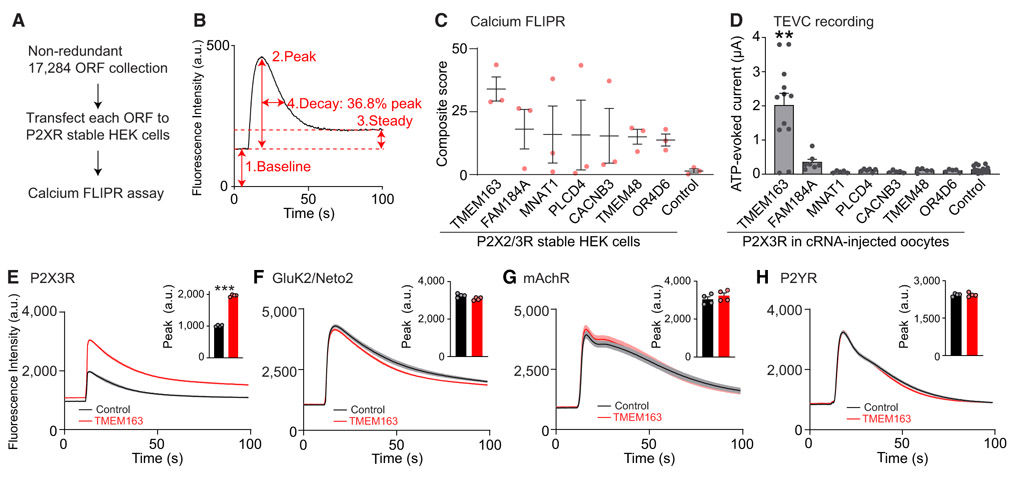
Figure 1. Genome-wide ORF-Based FLIPR Screening Identifies a P2X3R Modulator.
(A) Scheme of genome-wide ORF-based FLIPR screening.
(B) Analysis of each FLIPR response. Individual calcium FLIPR traces were analyzed using four different factors shown on the example trace: (1) baseline, (2) peak, (3) steady state, and (4) decay, as the time to reach 36.8% of the peak from the peak time, as well as the ratios of peak and baseline (5) and steady state and baseline (6) as baseline-normalized values. The effect of these factors were then multiplied together, creating a composite score for hit ORF prioritization.
(C) The top seven P2XR-specific ORFs and RFP (control) are listed based on composite score (n = 3).
(D) ATP (300 nM)-evoked currents were measured with two-electrode voltage clamp (TEVC) recording (Vh = −30 mV) from oocytes co-injected with 100 pg of P2X3R cRNA and 2 ng of cRNA for each ORF or Neto2 as a control (n = 5–20).
(E–H) Modulation of agonist-evoked calcium FLIPR responses by TMEM163 co-expression. HEK cells or HEK cells stably expressing P2X3R or GluK2 and Neto2 were transiently transfected with TMEM163 or pcDNA3 (control). Agonist-induced calcium FLIPR responses were measured from transfected cells pre-incubated with 0.3 U/mL apyrase for 1 h. Summary bar graphs of peak amplitude are shown in insets (n = 4). TMEM163 enhanced peak and steady-state responses of the P2X3R-stable HEK cells in response to α,β-MeATP (55.5 μM, E). TMEM163 did not affect the calcium FLIPR responses of GluK2/Neto2-stable HEK cells in response to 3.33 μM kainate (F), of HEK cells to 1 mM acetylcholine probing endogenous muscarinic acetylcholine receptor (mAchR) (G), and of HEK cells to 100 μM ATP probing endogenous P2Y receptors (P2YRs) (H).
Data are mean ± SEM. Kruskal-Wallis with Dunn’s post-test (D), two-way ANOVA followed by Bonferroni-Dunn’s post-test for (E)–(H); **p < 0.01; ***p < 0.001.

