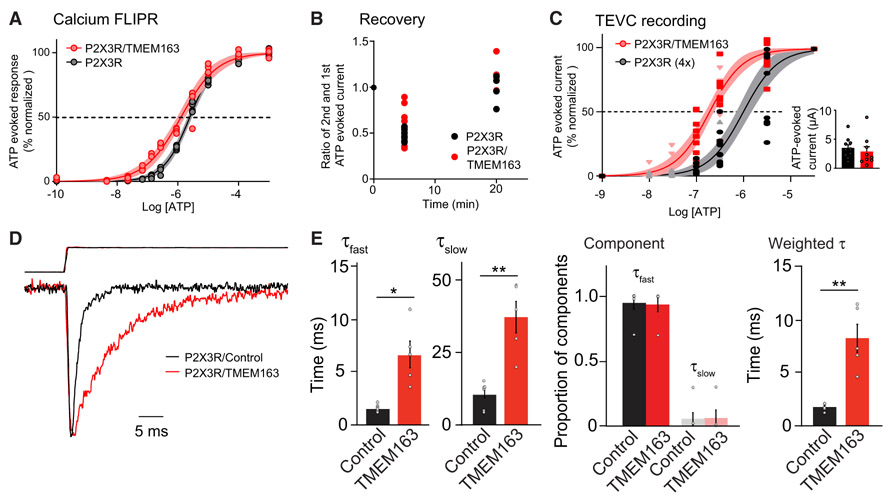
Figure 5. TMEM163 Shifts EC50 of ATP for P2XRs and Slows Decay Kinetics.
(A) Calcium FLIPR response at various concentrations of ATP was measured in HEK cells stably expressing P2X3R transfected transiently with TMEM163 or pcDNA3. Apyrase was pre-incubated for 1 h before stimulation to reduce extracellular ATP. P2X3R-stably expressing HEK cells responded to ATP, and co-expression of TMEM163 shifted the ATP EC50 (EC50: 1.27 ± 0.11 μM for P2X3R with TMEM163 and 2.50 ± 0.09 μM for P2X3R, p = 0.0013; Hill coefficient: 0.73 ± 0.04 for P2X3R with TMEM163 and 0.99 ± 0.03 for P2X3R p = 0.0023, n = 4). Data are mean ± SEM. Student’s t test.
(B and C) ATP-evoked currents from cRNA-injected oocytes were measured by TEVC recording (Vh = −30 mV). (B) TMEM163 did not affect recovery of ATP-evoked response of P2X3Rs at various intervals. ATP (10 μM)-evoked currents were measured at 5- or 20-min intervals, and the ratios of first and second ATP-evoked currents were calculated (n = 8). ATP-evoked responses were fully recovered with a 20-min interval. (C) TMEM163 shifted the ATP EC50 of P2X3R lower. To evaluate dose-response curves similarly, we adjusted the peak amplitudes of ATP-evoked currents of two conditions by injecting different amounts of P2X3R cRNAs: 25 pg of P2X3R with 2 ng of TMEM163 or 100 pg of P2X3R (4×) (small inset). We then measured ATP-evoked responses of various concentrations with a 20-min interval between stimulations for full recovery (n = 9). The estimated EC50 values were 0.26 ± 0.03 μM for P2X3R with TMEM163 and 1.30 ± 0.23 μM for P2X3R (4×). Hill coefficient: 0.98 ± 0.15 for P2X3R with TMEM163 and 1.04 ± 0.14 for P2X3R.
(D and E) TMEM163 slows the decay kinetics of P2X3R. We transiently transfected TMEM163-IRES2-EGFP (TMEM163) or IRES2-EGFP (control) in P2X3R-stably expressing HEK cells and applied 100 μM ATP to outside-out patch membranes of transfected cells using a piezoelectric device for ultrafast agonist application. (D) Superimposed traces of 100 μM ATP-evoked, peak-normalized responses (bottom) and open tip response (top) from outside-out parch membranes expressing P2X3R with either control (black, n = 6) or TMEM163 (red, n = 5). (E) The decays of the currents were fitted with bi-exponential curves, and fast and slow decay time constants (τfast and τslow) estimated (see STAR Methods for details). TMEM163 slows both fast and slow decay components without changing a proportion of each component (n = 6 for control, n = 5 for TMEM163). As a result, TMEM163 expression significantly slowed the weighted decay time constant (τ).
Data are mean ± SEM. Mann-Whitney U-test (E); *p < 0.05; **p < 0.01; ***p < 0.001.

