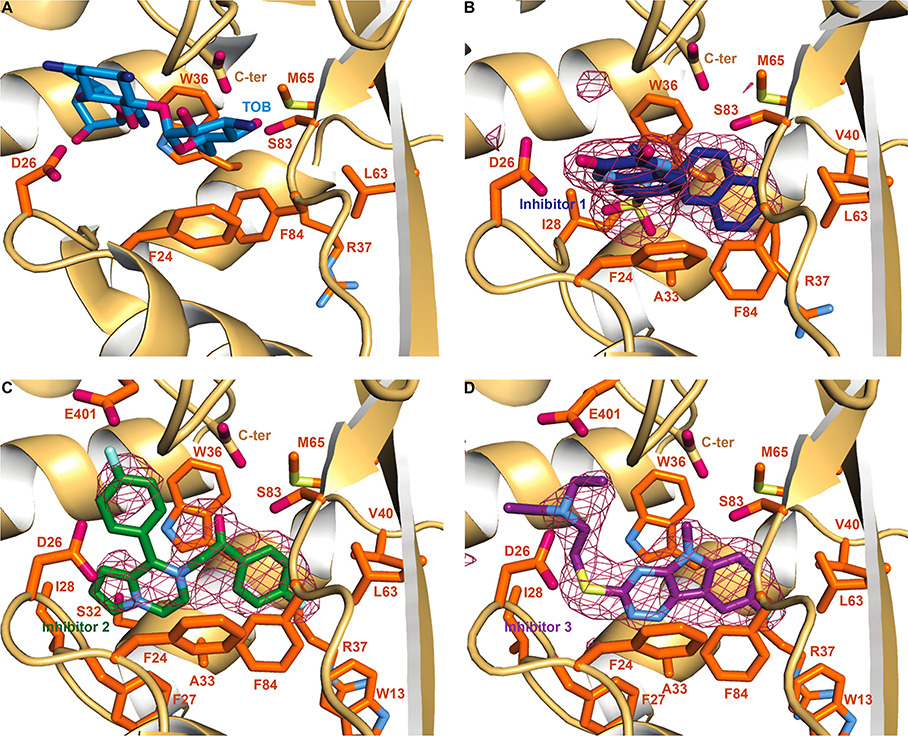
Figure 2.
Crystal structures of Eis monomer bound to TOB and the inhibitors. (A) The zoom-in view of the substrate binding site in the Eis–TOB complex (PDB ID: 4JD6).26 The Eis residues mutated in this study are shown as sticks in this panel. To simplify the view, the CoA was omitted in this figure. (B) The Eis–inhibitor 1 complex. A sulfate ion (the sulfur is shown in yellow and the oxygens in red) is also present. (C) The Eis–inhibitor 2 complex. (D) Eis–inhibitor 3 complex. Polder inhibitor omit maps27 contoured at 5σ are shown as a raspberry colored mesh in panels B, C, and D. The Eis residues interacting with TOB and the inhibitors are shown in orange. Oxygen, nitrogen, fluorine, and sulfur atoms are colored red, blue (light blue in inhibitors and Eis residues, dark blue in TOB), cyan, and pale yellow, respectively. Carbon atoms are colored light blue in TOB and dark blue, green, and purple in inhibitors 1, 2, and 3, respectively. The Eis C-terminus is labeled as C-ter.

