
Fig. 2.
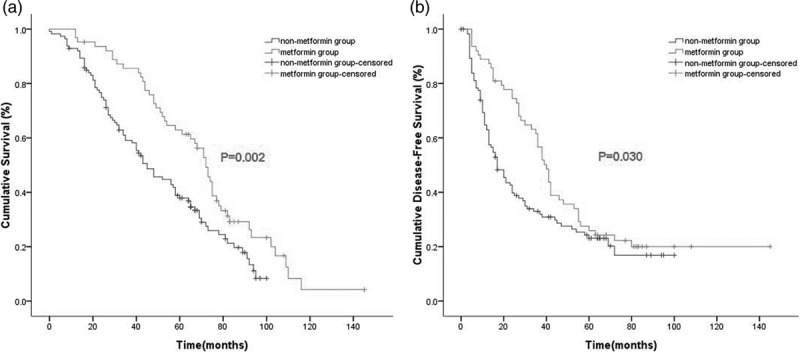
Kaplan–Meier survival curves for OS (a) and DFS (b) according to metformin usage in the propensity score-matched cohort (n = 176) (P values by stratified log-rank test). DFS, disease-free survival; OS, overall survival.
Official websites use .gov
A
.gov website belongs to an official
government organization in the United States.
Secure .gov websites use HTTPS
A lock (
) or https:// means you've safely
connected to the .gov website. Share sensitive
information only on official, secure websites.
Kaplan–Meier survival curves for OS (a) and DFS (b) according to metformin usage in the propensity score-matched cohort (n = 176) (P values by stratified log-rank test). DFS, disease-free survival; OS, overall survival.