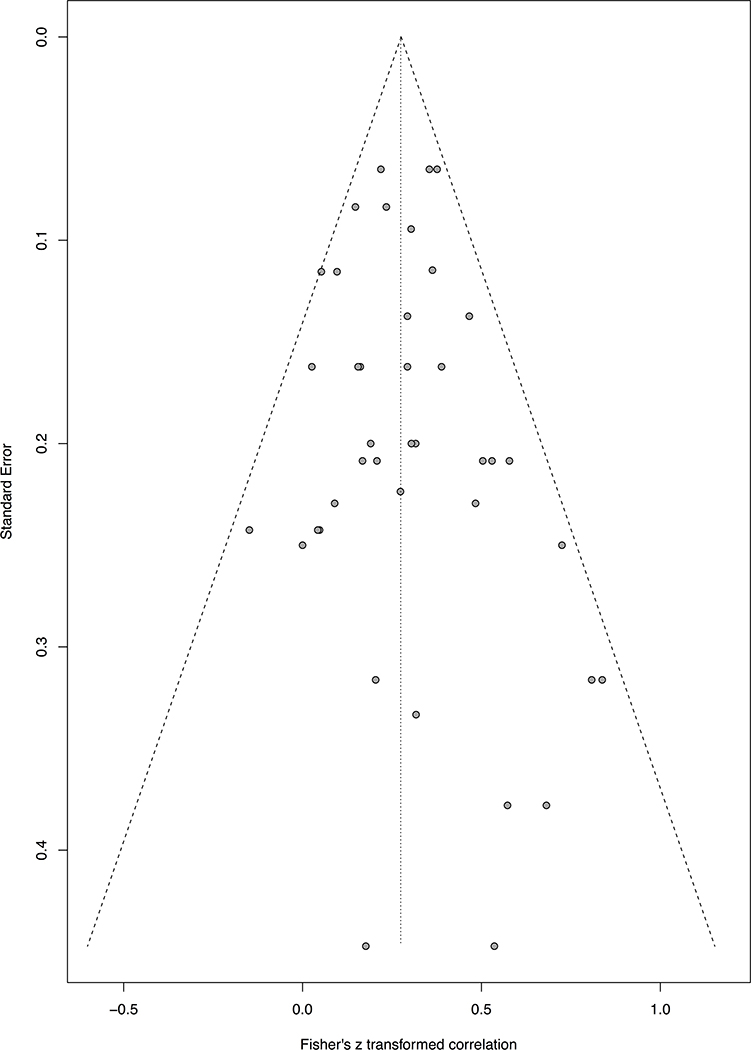
Figure 3.
Funnel plot showing potential publication bias of the included 17 reports with 40 effect sizes reported. The vertical line indicates the overall pooled effect size. On the ordinate, the standard error of each study is shown and on the abscissa, the effect size of each study analyzed is shown in Fisher’s z units. The circles plot each study on the funnel plot with higher publication bias indicated by circles outside the “funnel.”

