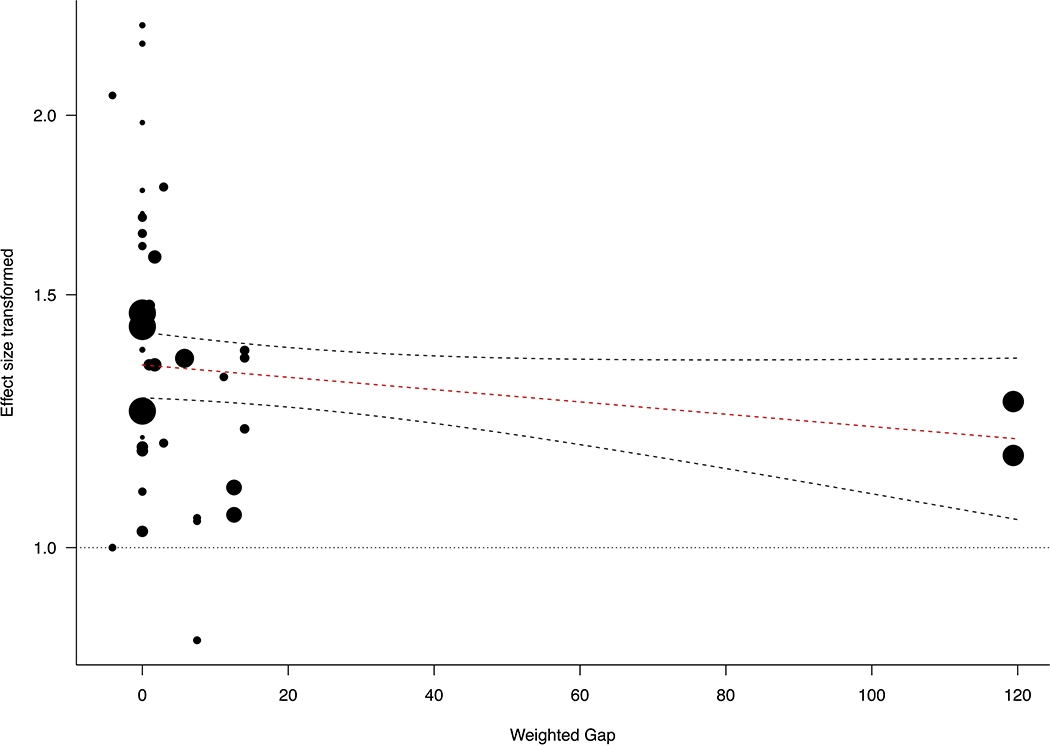
Figure 4.
Scatterplot showing the observed correlation (exponentially transformed) of individual effect size plotted against the quantitative predictor, the weighted gap between LENA recording and language test based on mixed-effects model. The radius of the points is drawn proportional to the inverse of the standard errors: larger/more precise studies are shown as larger points.

