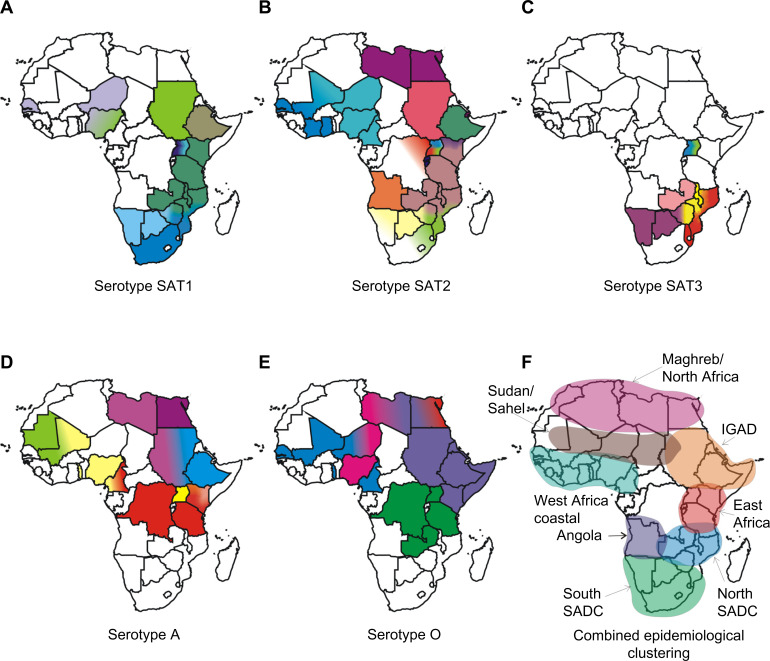
Figure 1.
Maps of Africa showing the serotype and topotype distribution.
Notes: The topotypes are color coded. The epidemiological clustering is indicated. The epidemiological clusters shown in the maps (A–F) do not necessarily indicate political borders of the countries.
Abbreviations: IGAD, Intergovernmental Authority on Development; SADC, Southern African Development Community; SAT, Southern African Territories.

