Figure 3.
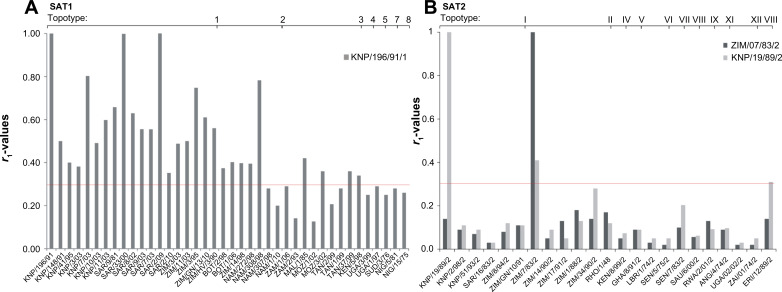
Chart to indicate the r1-values of various SAT1 and SAT2 foot-and-mouth disease virus isolates from different topotypes compared with antiserum prepared from the vaccine strains (A) SAT1/KNP/196/91 (topotype 1) and (B) SAT2/KNP19/89/2 (topotype I) and SAT2/ZIM7/83 (topotype II).
Notes: The antigenic relationships of the field isolates were determined using cross-neutralization assays on IB-RS-2 cells, carried out as described by the OIE.207 The r1-values were calculated as: r = serum titer against heterologous virus/serum titer against homologous virus, and interpreted as proposed by Samuel et al.104 Viruses from the Kruger National Park (South Africa) (KNP), South Africa (SAR), Ghonerazhou National Park (Zimbabwe) (GN), Zimbabwe (ZIM or RHO), Botswana (BOT), Namibia (NAM), Mozambique (MOZ), Angola (ANG), Zambia (ZAM), Malawi (MAL), Tanzania (TAN), Kenya (KEN), Uganda (UGA), Rwanda (RWA), Sudan (SUD), Zaire (ZAI) Ghana (GHA), Nigeria (NIG), Senegal (SEN), Eritrea (ERI), Saudi Arabia (SAU) were included in the study.
Abbreviations: OIE, World Organisation for Animal Health; SAT, Southern African Territories.

