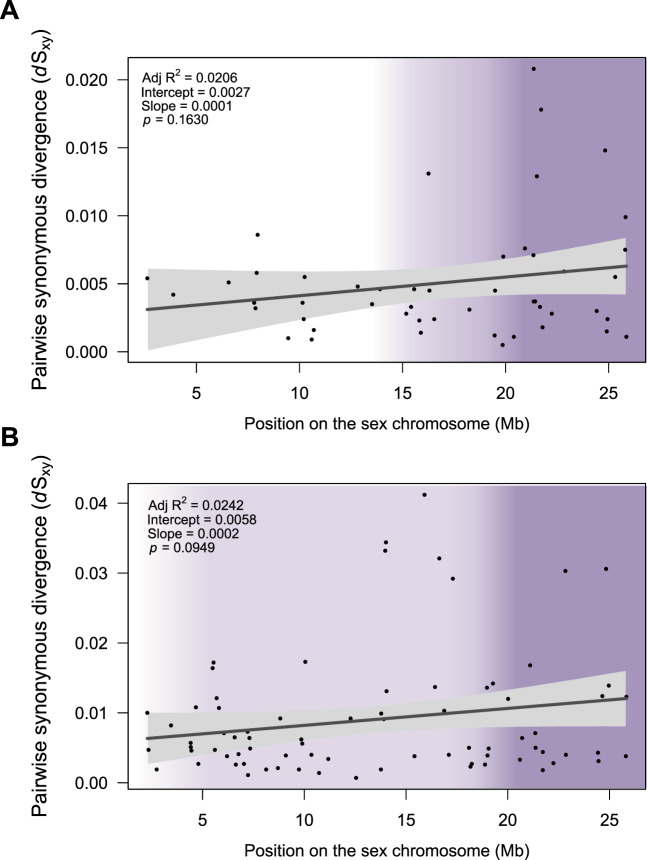
Fig. 3.
Pairwise synonymous divergence (dSXY) of P. reticulata (A) and P. wingei (B) sex-linked genes across the sex chromosomes. The shaded purple regions indicate the nonrecombining regions. Stratum I is shown in dark purple, where X–Y divergence is the greatest and Stratum II is shown in light purple. Lines show linear regressions fitted to the data using the lm function in R and gray-shaded areas represent confidence intervals for the slope of the regression lines.

