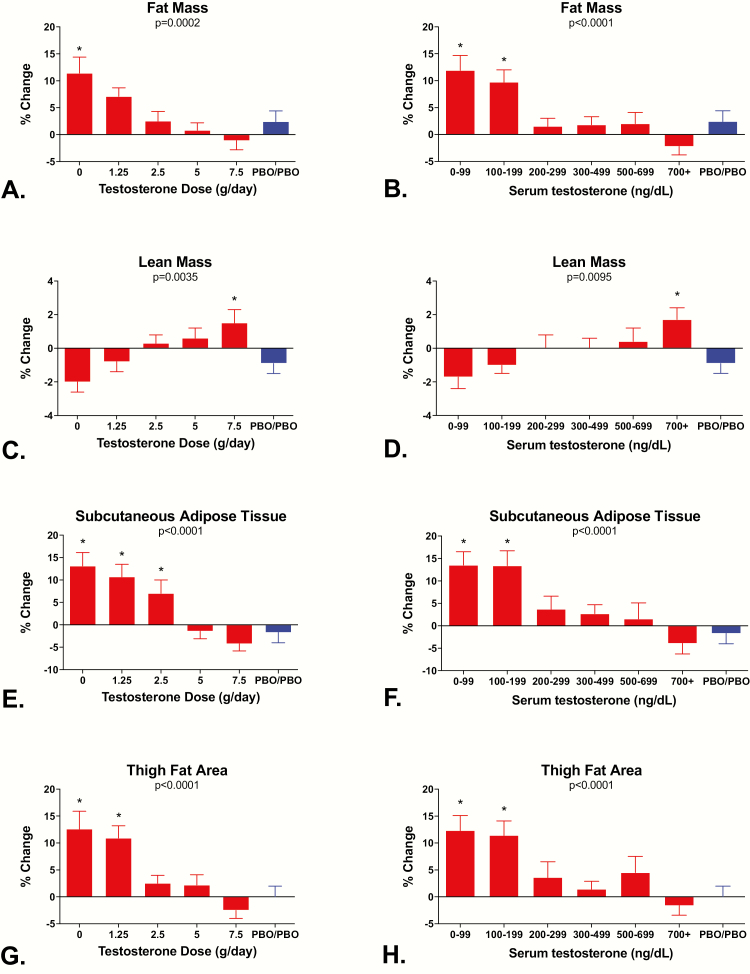
Figure 4.
Mean ± SE percentage change from baseline in total body fat mass by DXA, total body lean mass by DXA, subcutaneous fat area by CT, and thigh fat area by CT according to testosterone dose (A, C, E, and G) and testosterone levels (B, D, F, and H). P values for tests of dose-dependent linear trends for each measure are at the top of each panel. Men in Group 5 received either 7.5 or 10 g/day. *Denotes groups that are significantly different from the Control group using Duncan’s multiple range test.

