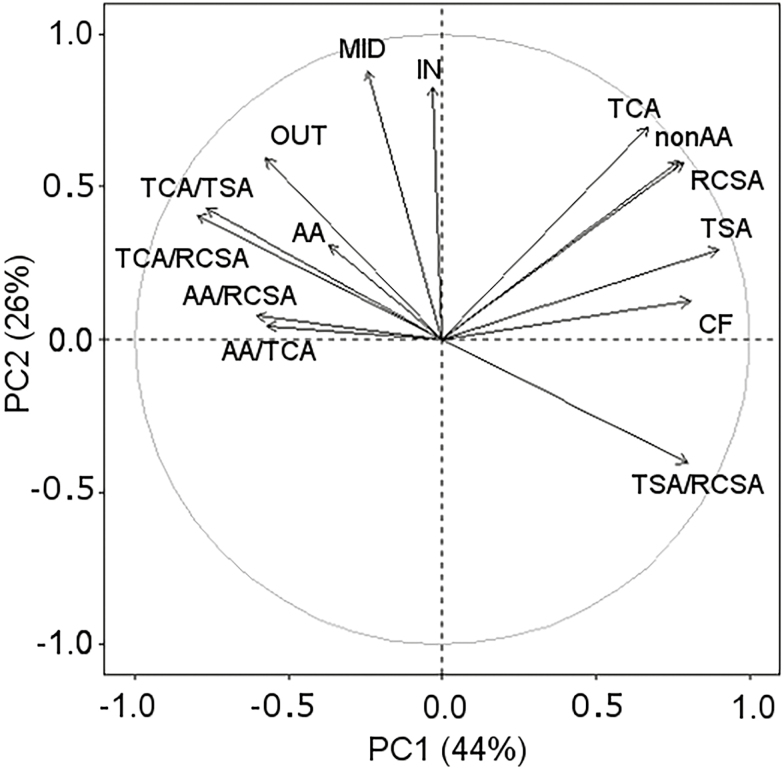
Fig. 4.
Principal component analysis (PCA) of 14 anatomical traits from root cross-sections across different fields, compaction treatments, and nodes. PCA loadings of the different variables illustrate how different anatomical traits relate to each other. Traits with arrows that group together are correlated to each other; traits with arrows in the opposite direction are negatively correlated with each other. When variables appear orthogonally from each other, associated traits do not correlate. Length of the arrow illustrates how strongly the trait is associated with each PC. Clockwise, abbreviations stand for: TCA, total cortical area; nonAA, non-aerenchyma cortical area; RCSA, root cross-sectional area, TSA, total stele area, CF, cell file number; TSA/RCSA; ratio of stele to root cross-sectional area, AA/TCA, ratio of cortex taken up by aerenchyma; AA/RCSA; ratio of cross-sectional area taken up by aerenchyma; TCA/RCSA, ratio of the cortex to root cross-sectional area; TCA/TSA, ratio of the cortex area to the stele area; AA, aerenchyma area; OUT; cell area of cells in the outer cortical region; MID. cell area of cells in the middle cortical region; IN, cell area of cells in the inner cortical region.

