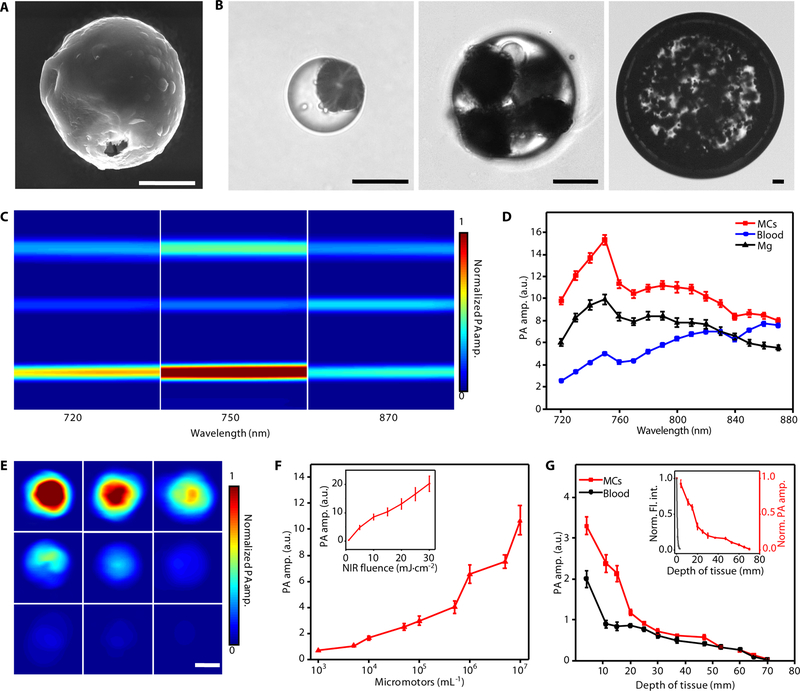
Fig. 2. Characterization of the MCs.
(A) Scanning electron microscopy (SEM) image of an ingestible micromotor. Scale bar, 10 μm. (B) Microscopic images of the MCs with different sizes. Scale bars, 50 μm. (C) PACT images of Mg particles, blood, and MCs in silicone rubber tubes with laser wavelengths at 720, 750, and 870 nm, respectively. Scale bar, 500 μm. (D) PACT spectra of MCs (red line), blood (blue line), and Mg particles (black line), respectively. (E and F) PACT images (E) and the corresponding PA amplitude (F) of the MCs with different micromotor loading amounts, and the dependence of the PA amplitude on the fluence of NIR light illumination (inset in F). Scale bar in E, 500 μm. (G) Dependence of PA amplitude of the MCs (red line) and blood (black line) on the depth of tissue, and the normalized PA amplitude and fluorescence intensity of the MCs under tissues (inset). Norm., normalized; amp., amplitude; Fl., fluorescence; int., intensity. Error bars represent the standard deviations from 5 independent measurements.

