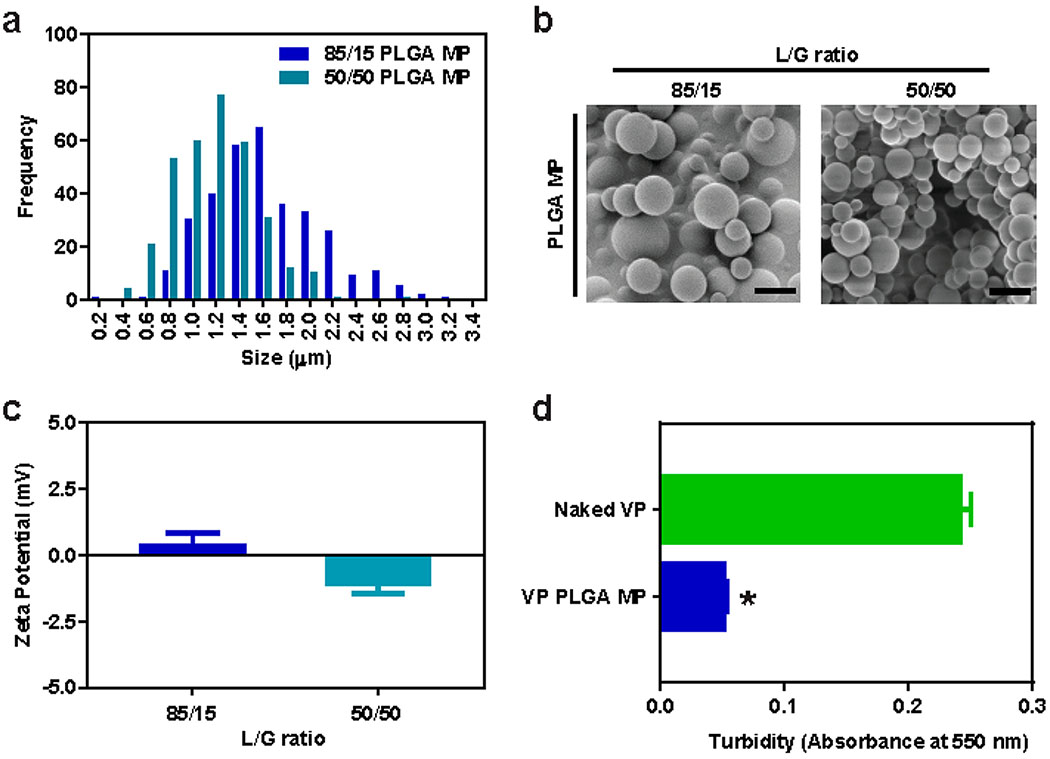
Figure 3. PLGA microparticle characterization.
(a) Histogram of 85/15 and 50/50 PLGA MP size distribution measured via ImageJ analysis of (b) representative SEM images. (c) Zeta potential of 85/15 and 50/50 PLGA MP measured in 10 mM NaCl with Zetasizer (n = 3). (d) Turbidity of PBS solution of naked VP vs VP-loaded 50/50 PLGA MP with equivalent VP concentration of 20 μg/mL, determined by absorbance at 550 nm (n = 3). All error bars are s.e.m. * = P < 0.05 as determined by unpaired Student’s t-test comparison.

