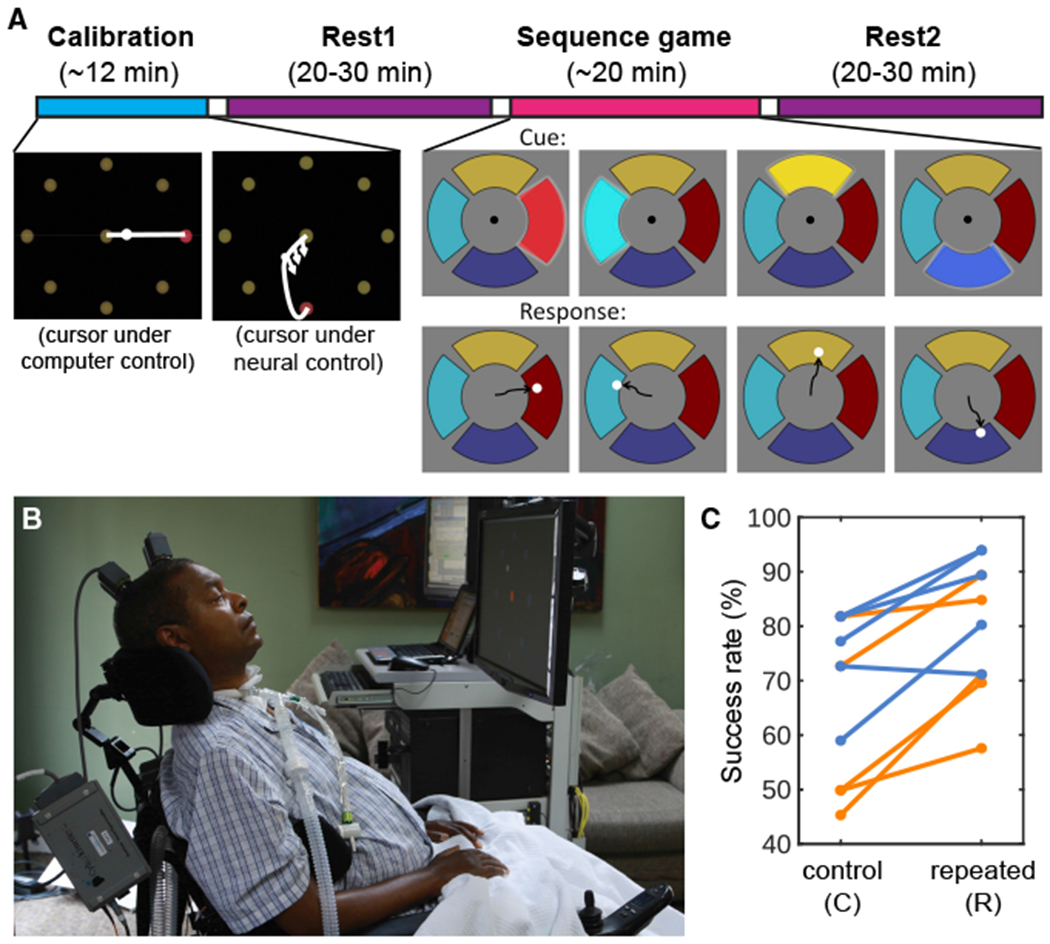
Figure 1. Research Session Setup.

(A) Task and timeline. In each session, a decoder was initialized and calibrated using an open-loop and then closed-loop center-out task (see Method Details; calibration inset modified from Jarosiewicz et al., 2015). The participant was then invited to relax with his eyes closed, and nap if desired, during a pre-task rest period (Rest1). Following Rest1, the participant performed the 4-target sequence game, consisting of 66 presentations of the repeated sequence (in this example, red-teal-yellow-blue), interspersed with 22 control sequences. Following the game, the participant was invited to relax with his eyes closed again (Rest2).
(B) Participant T9 at his home during a research session.
(C) Performance in the game, divided into control and repeated sequences. Each line represents one session from one participant (orange = T9 sessions; cornflower blue = T10 sessions). The success rate (% of sequences correctly completed) was significantly higher for the repeated than the control sequences (Wilcoxon signed-rank test, n = 10, p = 0.0039), suggesting preferential learning of the repeated sequences.
