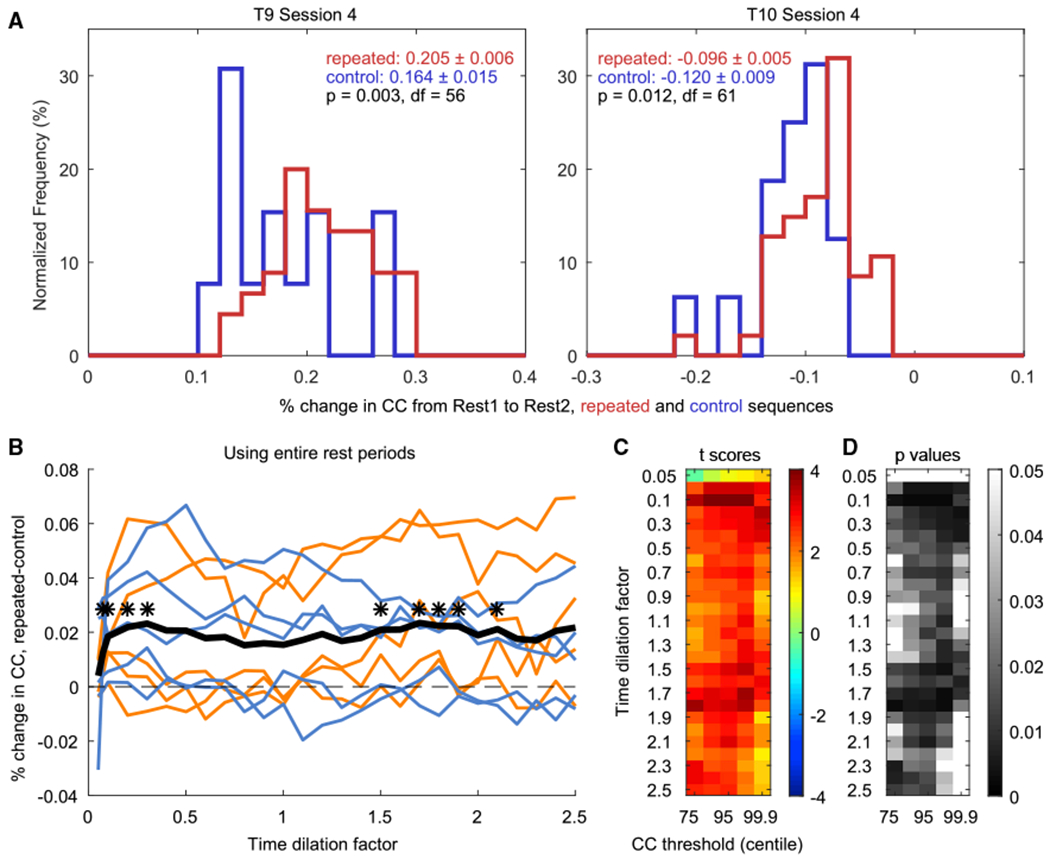
Figure 2. Replay of Firing Rate Patterns in Motor Cortex.

(A) Examples of distributions of RIs. One value in each distribution is the RI for one trial (the % change in mean peak CC values from Rest1 to Rest2 when using that trial as the template). The red distributions were obtained using the repeated sequence trials as templates, and the blue distributions were obtained using the control trials. Neural signal nonstationarities can cause spurious drifts in CC values; thus, replay was measured as the difference between the repeated and the control trials’ RIs. In both example sessions (one from each participant), the repeated sequence trials (mean ± SEM in red) showed significantly higher (i.e., more positive) RIs than the control sequence trials (in blue; two-sample one-tailed t test).
(B) Difference in mean RI (repeated – control) for each session at all time dilation factors (using a CC threshold at the 95th centile). Sessions with T9 are shown in orange and those with T10 in cornflower blue. The mean across sessions is shown with a thick black line. Asterisks denote time dilation factors at which the repeated-trial mean RIs were significantly higher than the control-trial mean RIs across sessions (paired one-tailed t test, n = 10; *p < 0.01).
(C and D) The t scores (C) and corresponding p values (D) resulting from testing, for each time dilation factor and centile threshold, whether the repeated-trial mean RIs were higher than the control-trial mean RIs across sessions (paired one-tailed t test, n = 10). Note that the middle columns of (C) and (D) correspond to the data shown in (B).
