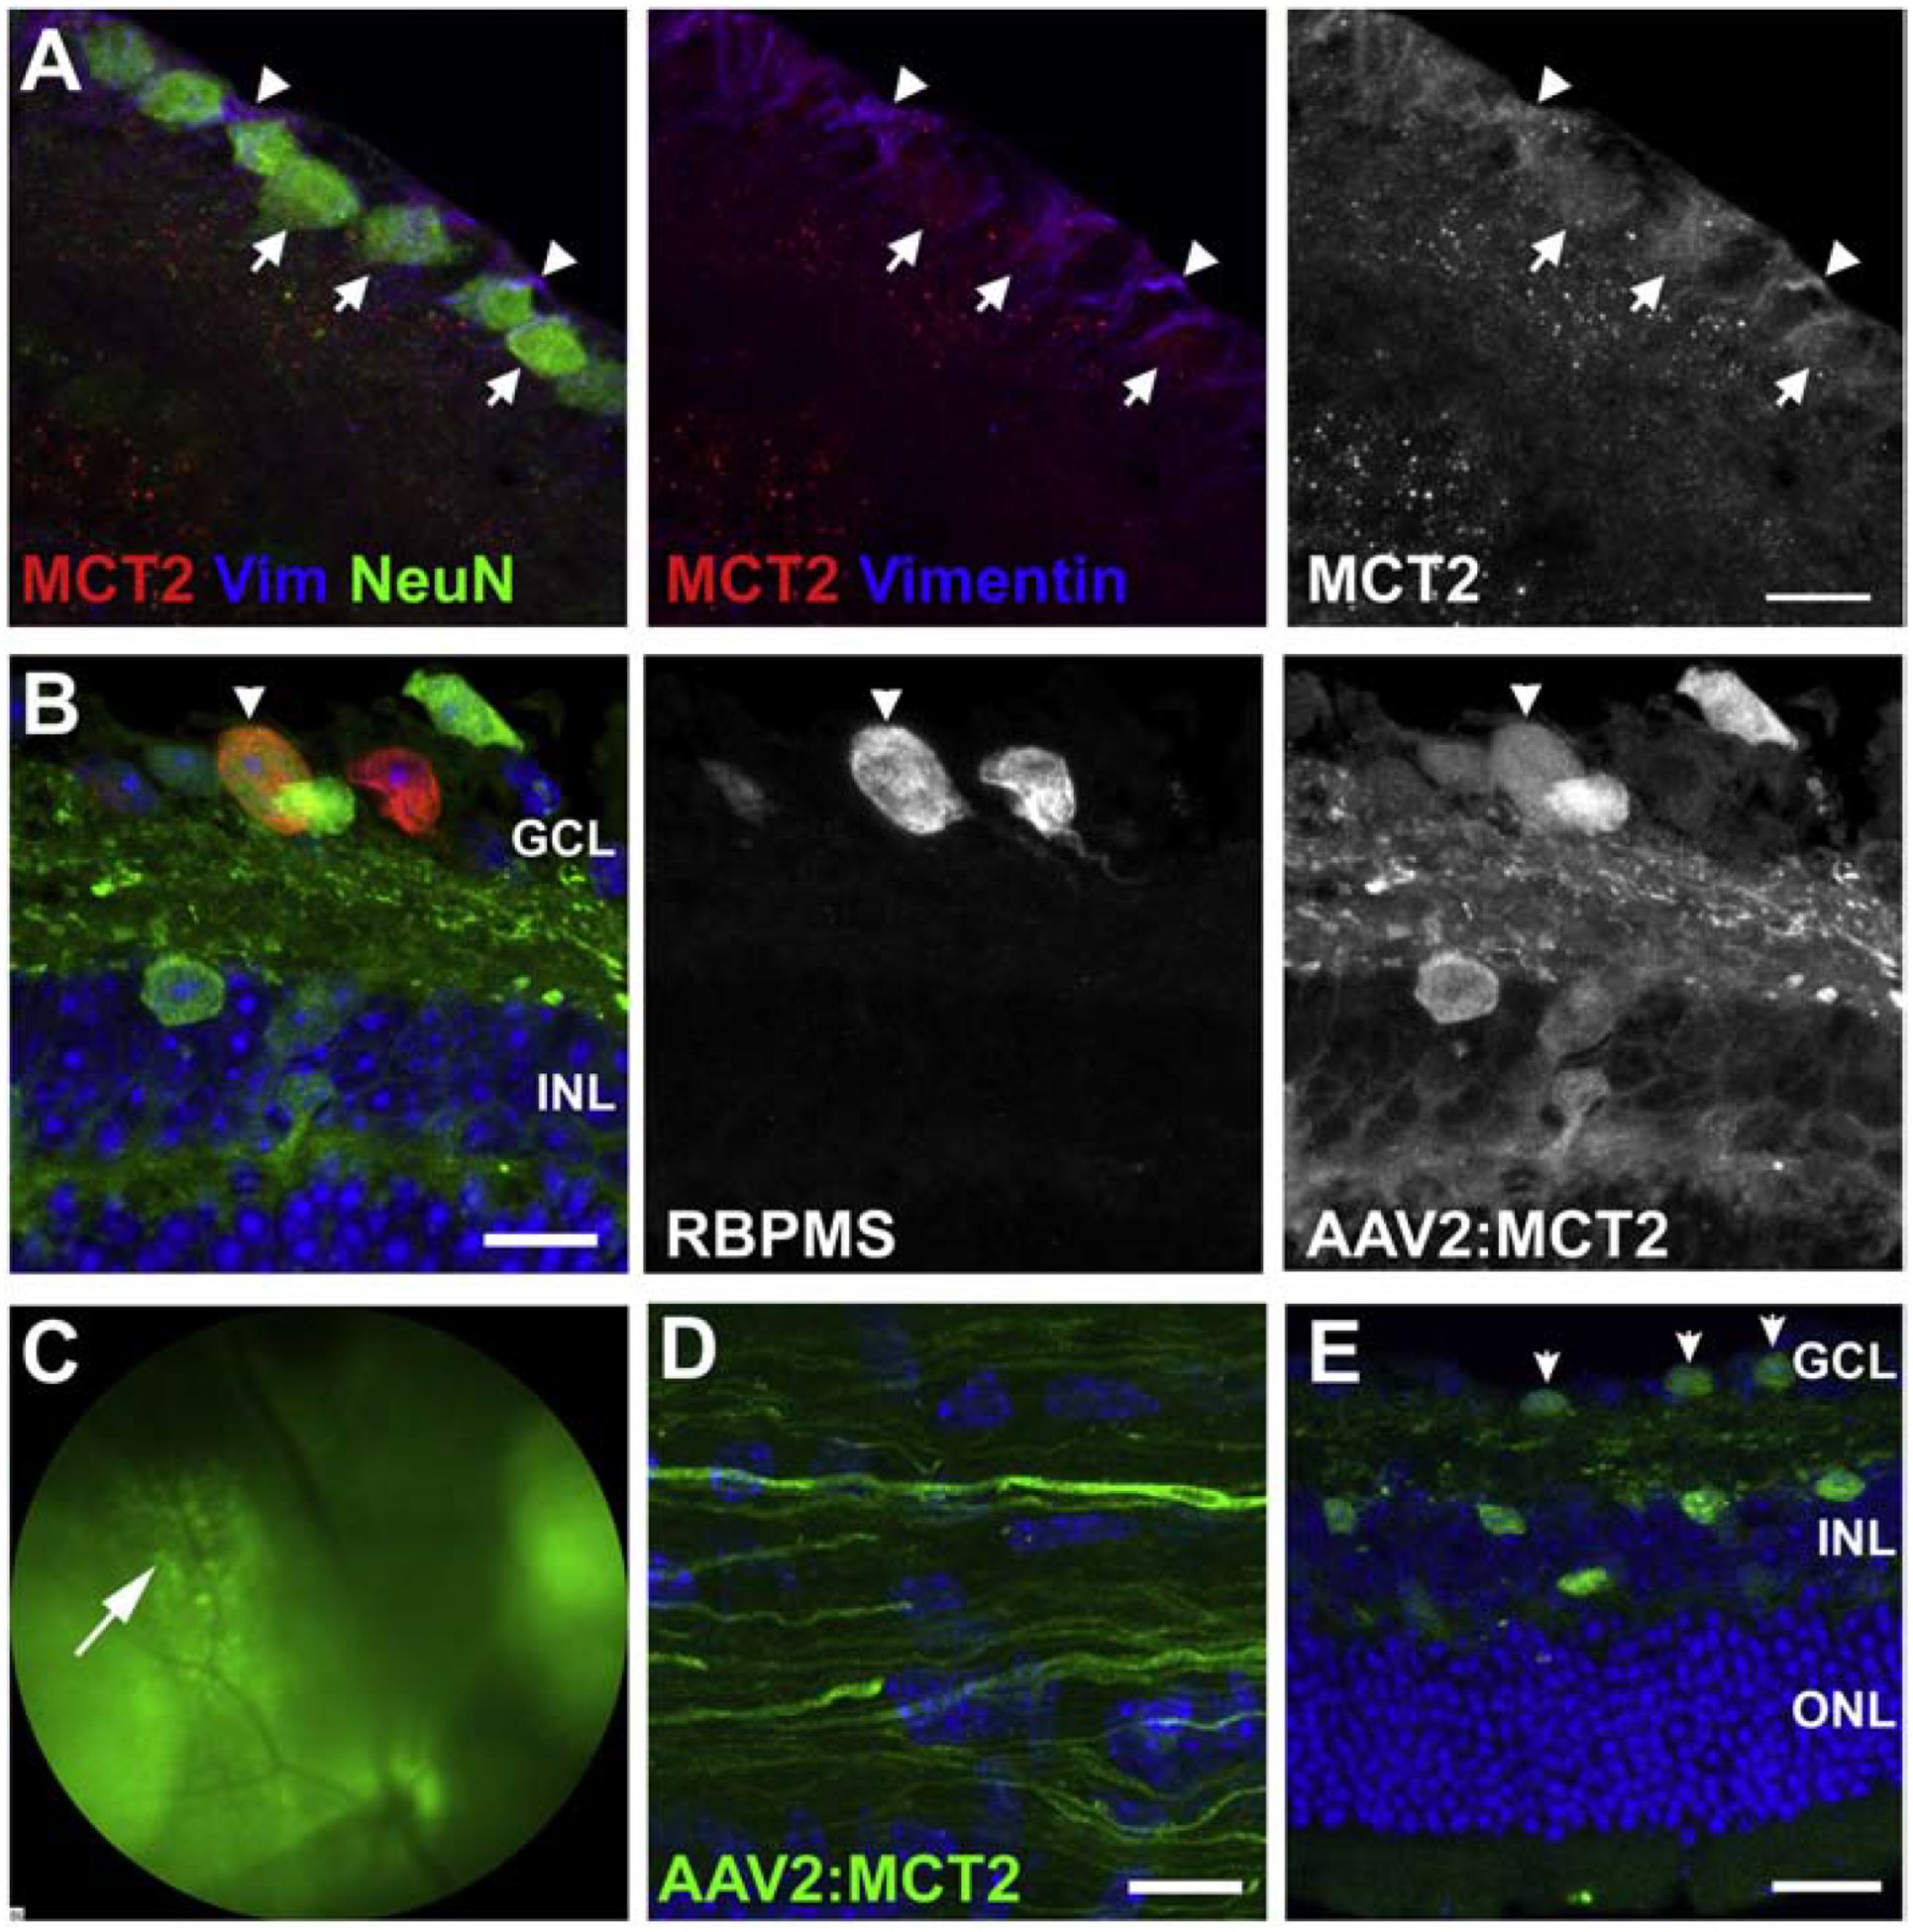
Figure 2:

MCT2 protein distribution and AAV2:MCT2 virus infection. A. Immunofluorescence of control retina to show MCT2 localization on retinal ganglion cells. The left panel is a merged image of MCT2 (red) with Vimentin (Müller glia, blue) and NeuN (RGCs, green). In the middle panel, NeuN has been removed in order to discern the red puncta along both RGC somas and Müller glia endfeet. The right panel shows MCT2 alone. Scale bar is 15μM. B. A cross-section from a 12 month-old D2 retina injected with AAV2:MCT2 two months prior. Arrowheads point to an infected RGC in the GCL that is RBPMS-positive and positive for the eGFP from the AAV2:MCT2 virus. INL=inner nuclear layer; OPL=outer plexiform layer. Scale bar=15μm. C. Fundus photograph of a 10.5 month-old DBA/2J (D2) eye injected with AAV2:MCT2, two weeks after injection (left). The arrow points to GFP-positive cells in the ganglion cell layer (GCL). D. Section of a 12 month-old D2 optic nerve from an eye injected with AAV2:MCT2. The eGFP-positive axons confirm the infection of RGCs with the virus and the widespread transport of the eGFP. Scale bar=20μm. E. Sagittal section of a 12 month-old D2 retina injected with AAV2:MCT2 two months prior. Arrows point to infected cells in the GCL that are eGFP-positive from the AAV2:MCT2 virus. Infected cells are observed in the GCL and INL. Scale bar=50μm. GCL=ganglion cell layer; INL=inner nuclear layer; OPL=outer plexiform layer.
