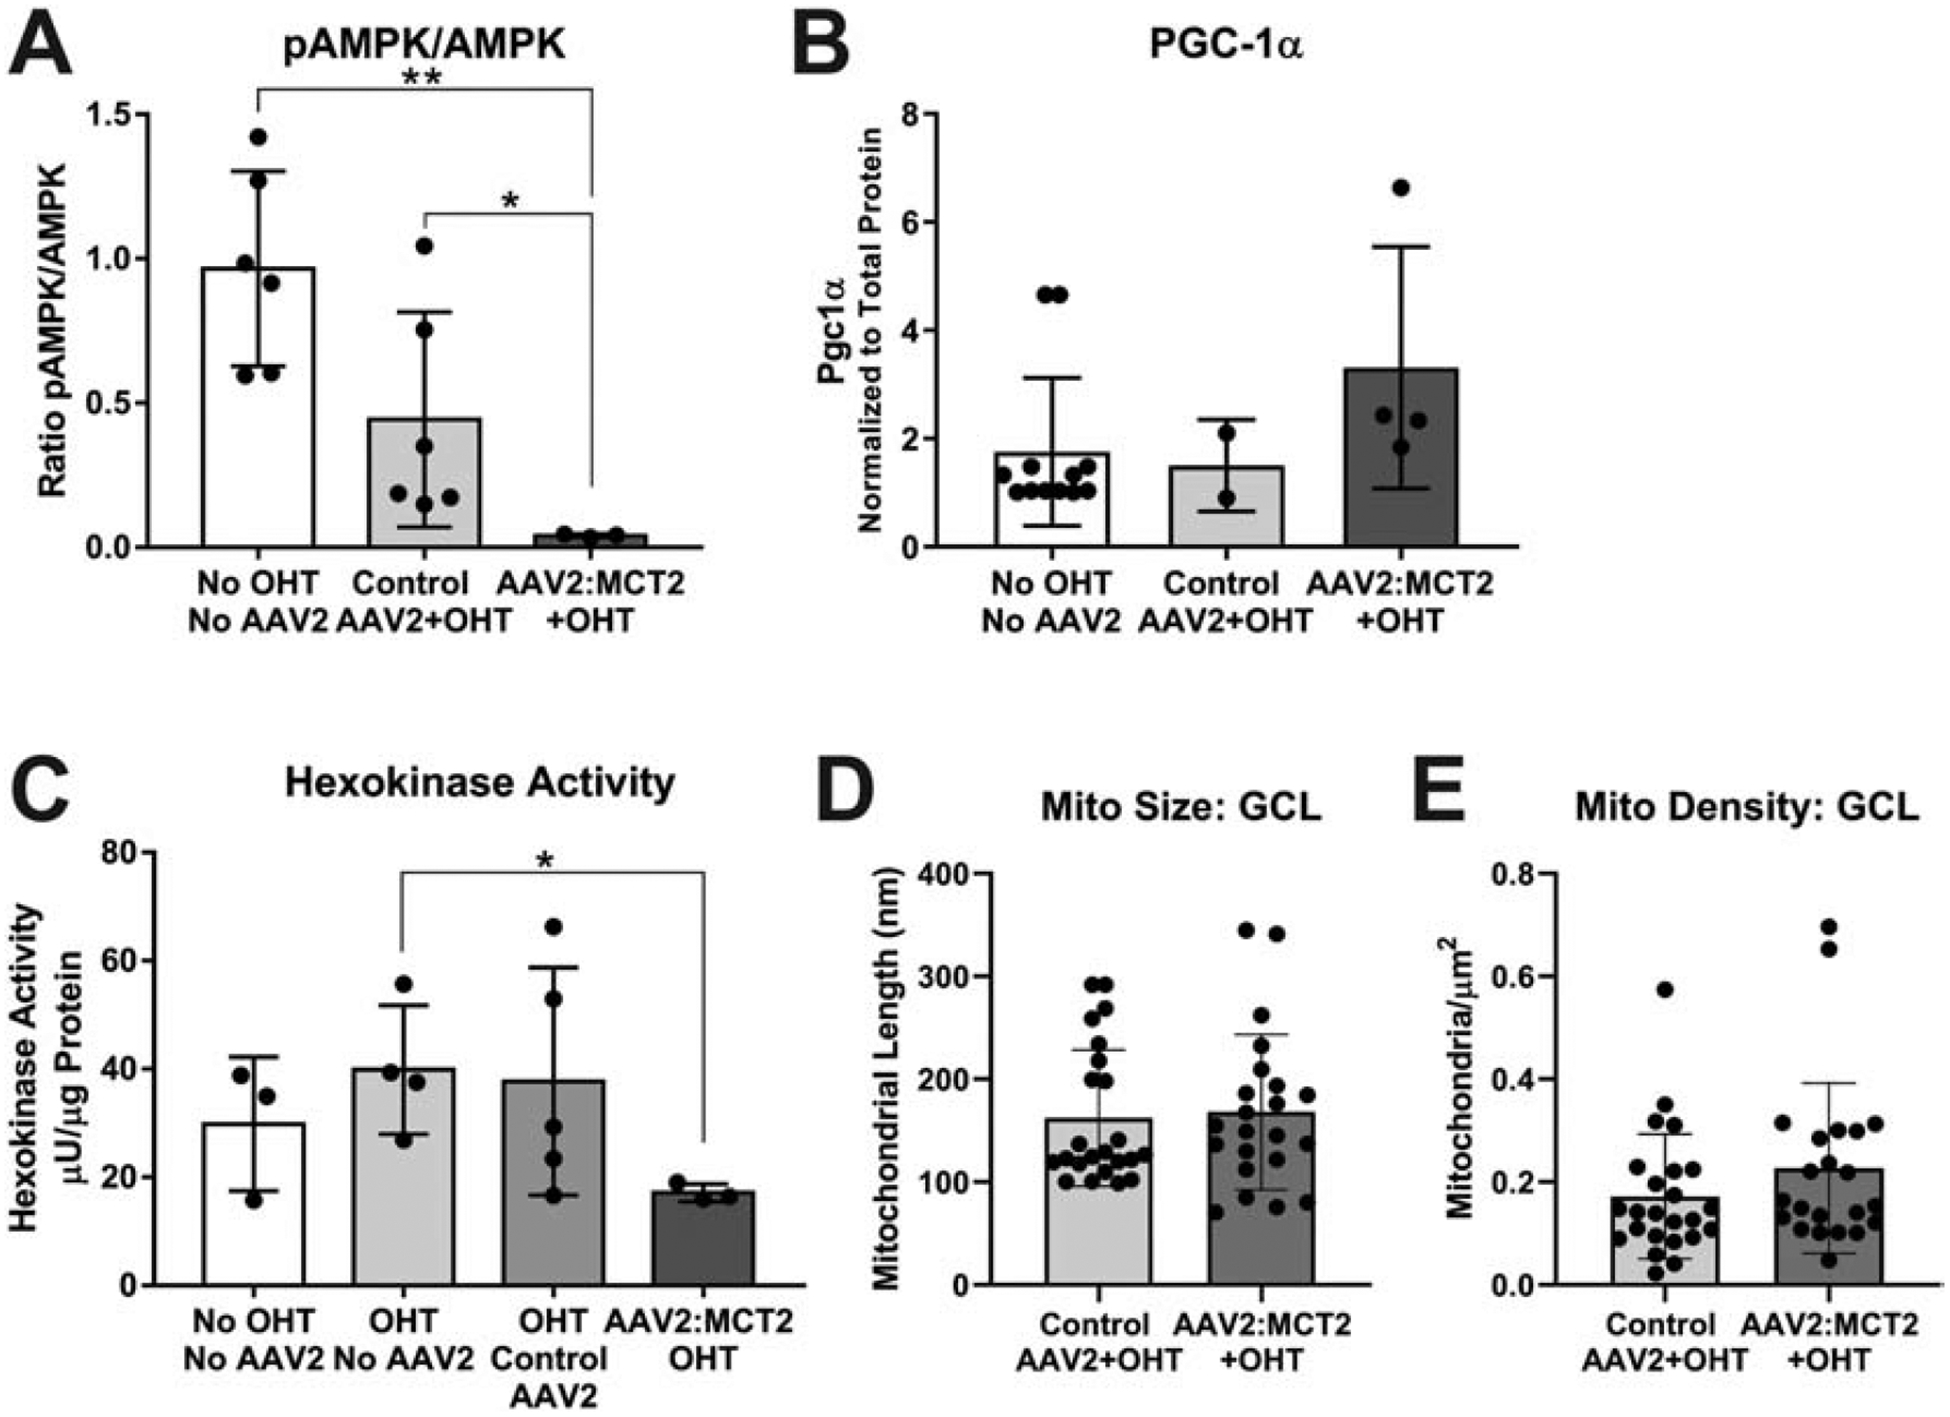
Figure 7:

Metabolic changes in ON from OHT mice injected with AAV2:MCT2. A. The ratio of phosphorylated AMP kinase (pAMPK) to AMPK is significantly lower in OHT mice injected with AAV2:MCT2 (n=5) compared to control mice (no OHT or virus, n=6) and OHT mice injected with AAV2:GFP (n=6; p<0.01, p<0.05 respectively). B. PGC-1α protein in ON did not differ statistically across groups. ON sample number was n=12 for the No OHT, No AAV2 group, n=3 for the Control AAV+MCT2 group, and n=4 for the AAV2:MCT2+OHT group. C. Hexokinase activity is significantly decreased in OHT mice injected with AAV2:MCT2 (n=3) compared to OHT mice alone (n=4; p<0.05). ON sample number was n=3 for the No OHT, No AAV2 group, and n=5 for the OHT Control AAV2 group. D. Mitochondria size and E. Mitochondria density in the ganglion cell layer (GCL) did not differ across the Control AAV2+OHT (n=24 retinal sections across 3 mice) and AAV2:MCT2+OHT (n=22 retinal sections across 3 mice) groups. Error bars are SD.
