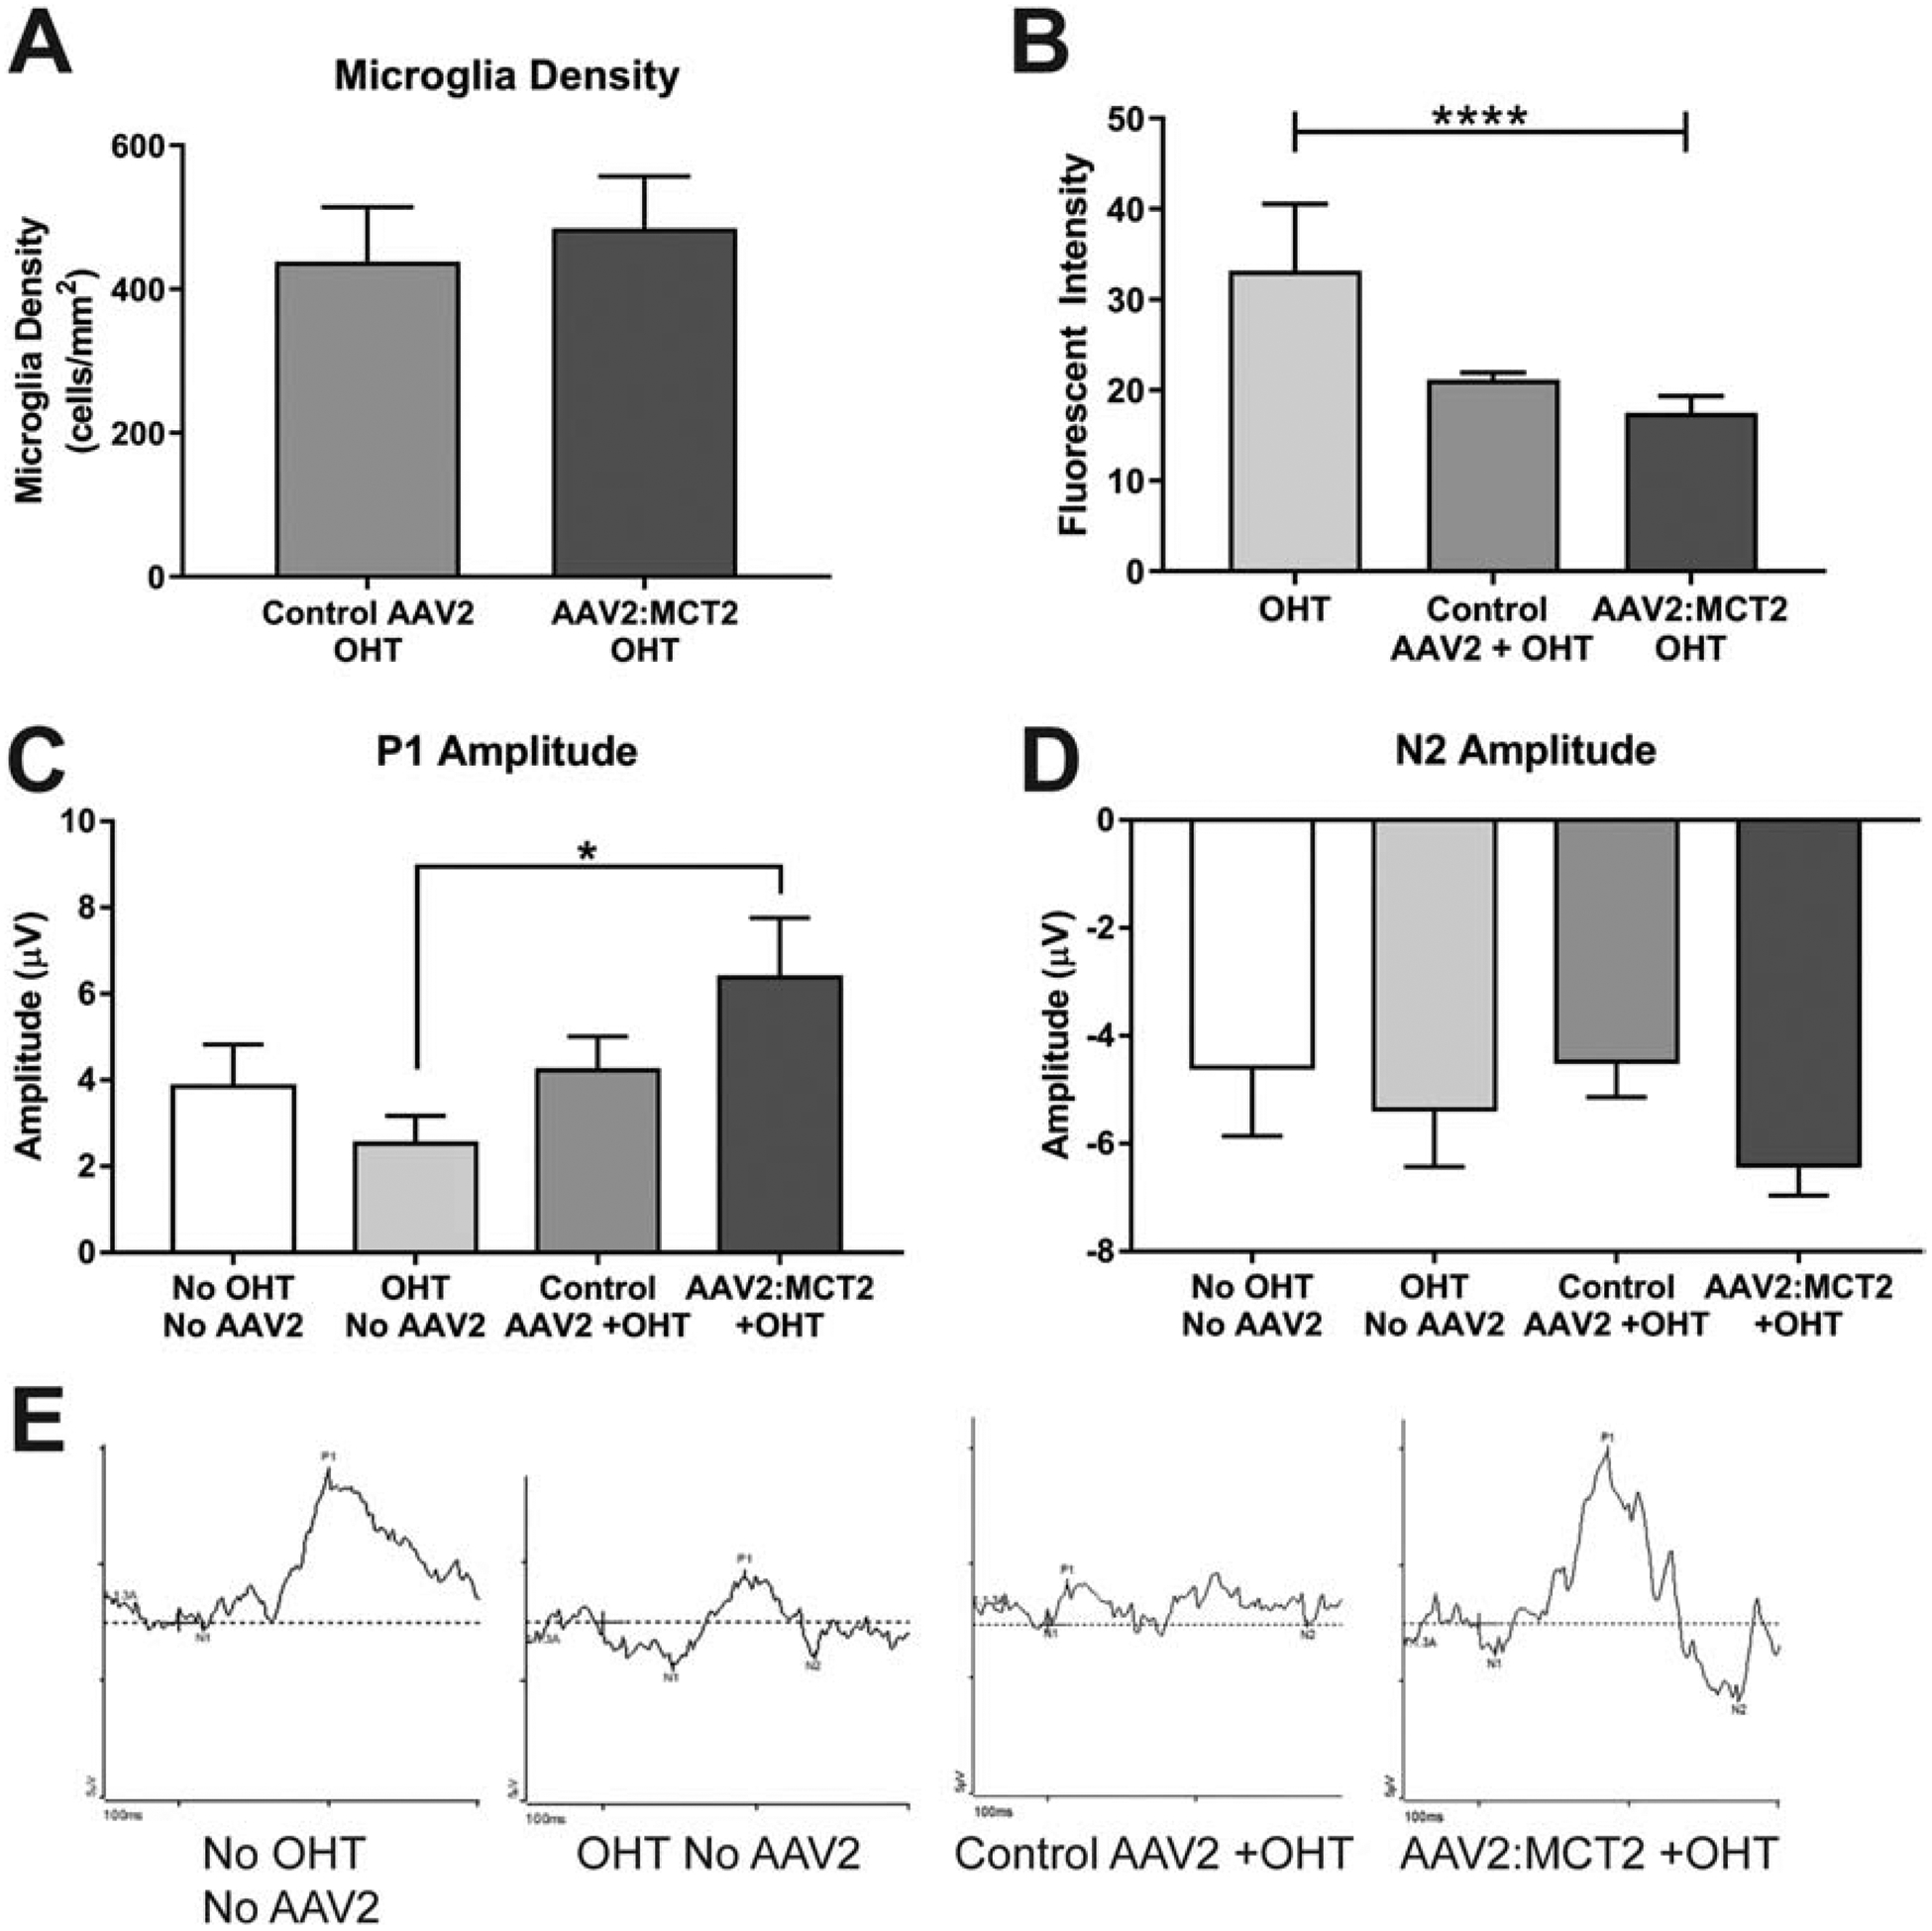
Figure 9:

Retinal microglia and pattern electroretinogram in OHT mice. A. Microglia density did not differ between OHT eyes injected with control virus (AAV2:eGFP, n=12 sections from 3 retinas) or AAV2:MCT2 (n=16 sections from 4 retinas). B. Intensity of Iba1 immunolabeling was significantly different across groups, with virus injection having a lowering effect on fluorescence intensity of Iba1 (ANOVA, p<0.0001). Samples sizes for this analysis was n=12 retinal sections from 3 retinas per group. C. Pattern electroretinogram shows significantly higher P1 amplitude in OHT animals injected with AAV2:MCT2 (n=12 mice) than in OHT alone (n=12 mice; p<0.05). Sample size also n=12 for the No OHT, No AAV2; and the Control AAV2+OHT groups. D. N2 amplitude did not differ across experimental groups; sample number as in C. Error bars are SD. E. Example PERG traces for each of the groups represented in C and D.
