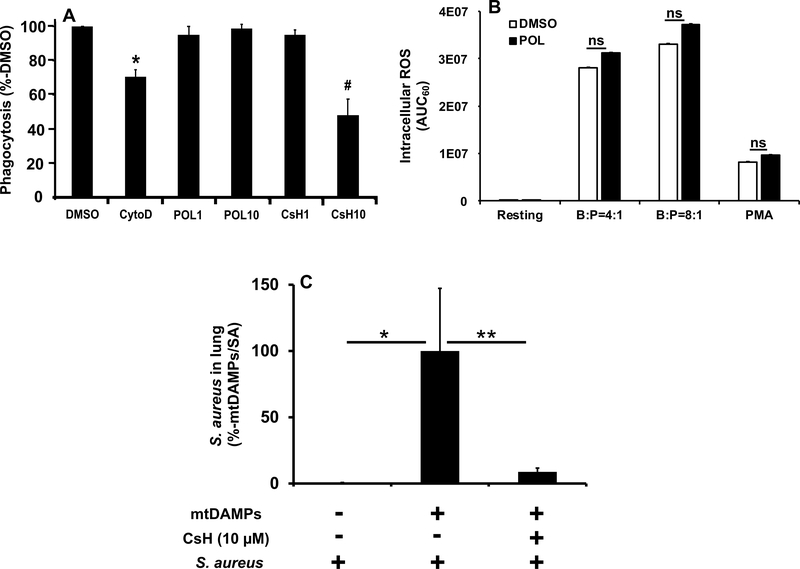
Figure 5. Role of FPR1 in PMN antimicrobial functions.
A: FPR1 role in phagocytosis by PMN. Human PMN were incubated with pHrodo-labeled bacteria (ratio 20:1) for 30 min at 37°C as described in Supplemental Digital Content 1. Control PMN were pretreated with vehicle (1% DMSO). Experimental groups were treated with 10 μg/mL Cytochalasin D, with 1 or 10 μM POL7200, or with 1 or 10 μM CsH. All experiments were repeated using three different PMN preparations. The number of bacteria phagocytosed per PMN was assayed by flow cytometry. Data were normalized to the phagocytosis of bacteria by vehicle-treated PMN (established as 100%). Mean ± SE values are shown. Cytochalasin D was used as a positive control and showed the expected suppression of phagocytosis. FPR1 blocking by POL7200 showed no detectable inhibition of bacterial phagocytosis either at 1 μM (~EC50) or at 10 μM (~EC90)(see Figure 2). 1 μM CsH (~EC20) had no effect on phagocytosis. Unexpectedly, 10 μM CsH (~EC50) significantly decreased phagocytosis. *: p<0.005 vs. all other treatments. #: p<0.0001 vs. all except vs. CytoD (p=0.0412).
B: Effect of POL7200 on S. aureus induced ROS production by human PMN. Details can be found in Supplemental Digital Content 1. PMN were pretreated with 1% DMSO (vehicle) or 10 μM POL7200 for 30 min at 37ºC with rotation. Finally, PMN were loaded with detection reagent mix that contains luminol, superoxide dismutase, and catalase. PMN were then treated with S. aureus at 1:4 and 1:8 ratio, with 500 nM PMA (positive control), or with DPBS+ (vehicle, resting negative control) for 60 min and intracellular ROS production was studied. Area under curve for 60 min was calculated and compared. Mean ± SD values are shown. Data are representative of 3 different experiments. Statistical Analysis was done by One-Way ANOVA with Tukey’s test.
C: Effect of FPR1-blocking on secondary bacterial infection in lungs after injury in a mouse injury model. C57BL6 mice were divided into three groups as described in Supplemental Digital Content 1. Group 1: controls received S. aureus intratracheally at time 0. Group 2: injury model without treatment. mtDAMPs (equivalent of 10% liver) and DMSO (vehicle) were applied intraperitoneally at time “−3 h” followed by S. aureus administered intratracheally at time “0”. Group 3: treatment group. Similar to Group 2 except that mice received CsH (10 μM final) not DMSO at time “−3 h”. At time “16 h” animals were sacrificed and whole lungs were homogenized in 2 mL saline. Aliquots were applied to agar plates to evaluate bacteria number in lungs. S. aureus in lungs were normalized to Group 2 established as 100%. * and ** denote significant difference, p=0.0439 and p=0.0303, respectively. Statistical analysis was done by One-Way ANOVA with Tukey. Mean ± SE values are shown. Group 1: n=17, Group 2: n=17, Group 3: n=19.

