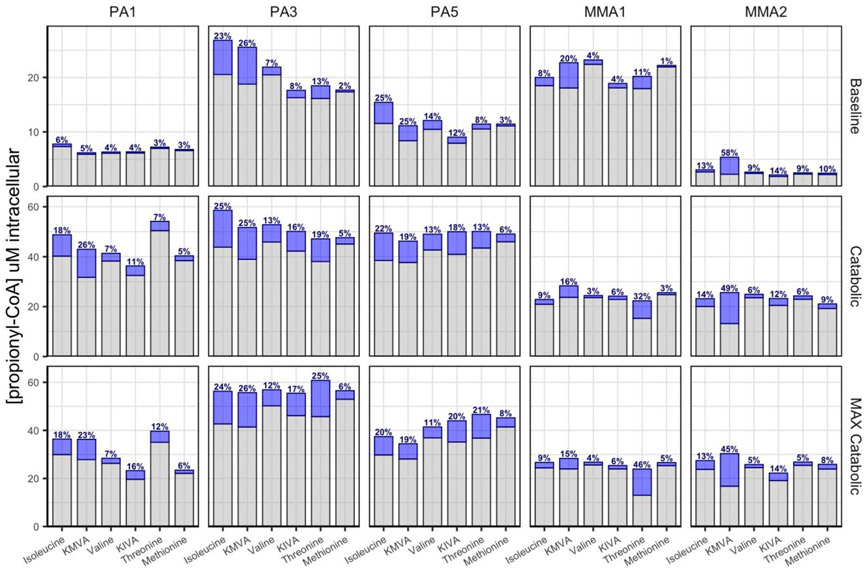
Figure 5:
Propionyl-CoA (P-CoA) sources and their relative contribution in different disease states. Three different formulations were used to simulate different disease states: 1) ‘Baseline metabolic state’ 2) ‘Catabolic state’ or 3) “MAX catabolic state’ (Table S1). One P-CoA precursor at a time was replaced with its 13C-labeled analog within each media formulation and 13C-P-CoA (blue) was measured and % contribution was calculated. Endogenous 12C-P-CoA produced from the other unlabeled precursors is shown in gray bars. N= 4 biological replicates, N=1 technical replicates.

