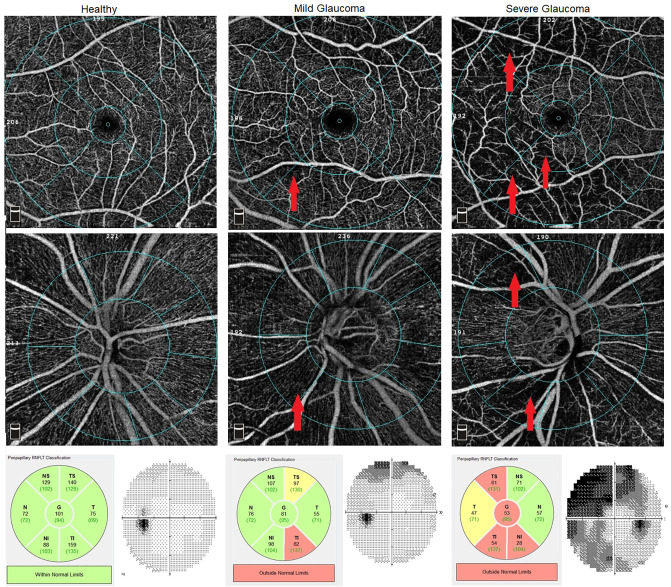
Fig 1. Optical coherence tomography angiography (OCTA) of vessel density (VD) map in healthy, mild and severe glaucoma.
Top row and second row show the macular superficial l vascular plexus (SVP) (scan 6x6mm) and radial peripapillary capillaries (RPC), respectively. Bottom row: Peripapillary retinal nerve fiber layer (pRNFL) analysis from Spectral domain optical coherence tomography (SD-OCT) and standard automated perimetry (SAP) visual field (VF). The first column shows the healthy patient with normal VD. The second column: patient with mild glaucoma. Notable VD reduction at the inferonasal region of peripapillary RPC (pRPC) and perifoveal retina was observed (red arrows). pRNFL defects at the inferotemporal sector were noted on SD-OCT. pRNFL defects and capillary dropout area were compatible with superior VF scotomas observed in the SAP. Third column: In patient with severe glaucoma the superior arcuate scotoma and defects in inferotemporal quadrant are consistent with capillary dropout at the inferior and superior region of the pRPC and parafoveal and perifoveal retina (red arrows). The pRNFL evaluation shows abnormalities in the temporal and inferior quadrants.

