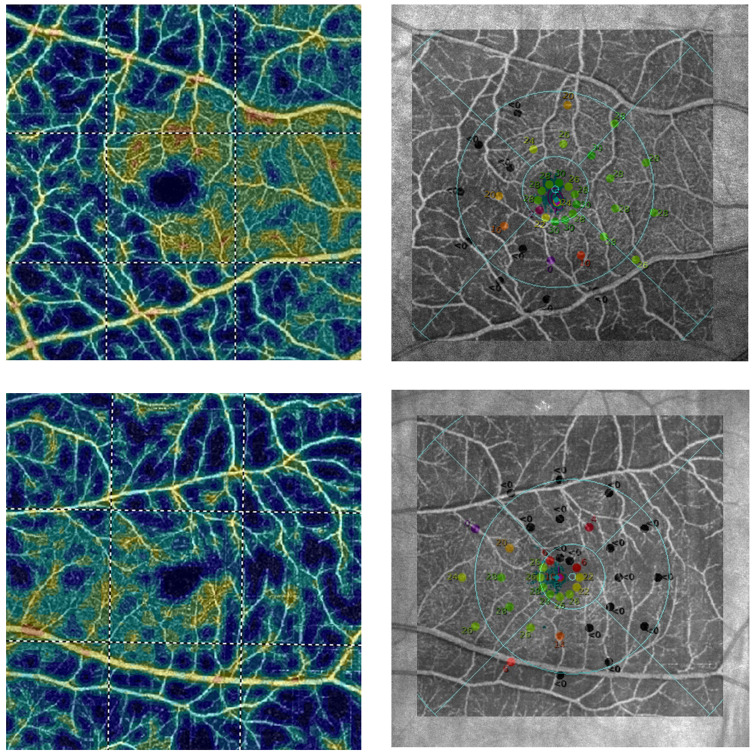
Fig 2. Relationship between sensitivity threshold points in the microperimetric (MP) examination of the retina and en face angiogram of superficial retinal vascular plexus (SVP) in the macula using optical coherence tomography angiography (OCTA).
Top row: Right eye of female with primary open-angle glaucoma (POAG). Bottom row: Left eye of male with POAG. First column: The OCTA colour-coded vascular map of macular SVP. Cold colours on angiograms indicate capillary dropout areas. Second column: on the Scanning Laser Ophthalmoscope image with sensitivity threshold points in the MP examination, en face angiogram of macular SVP was superimposed to show the relationship between function and structure of the retina. Points at which sensitivity threshold was reduced or where there were deep scotoma points (black dots) in the MP, corresponded exactly to capillary dropout areas in OCTA.

