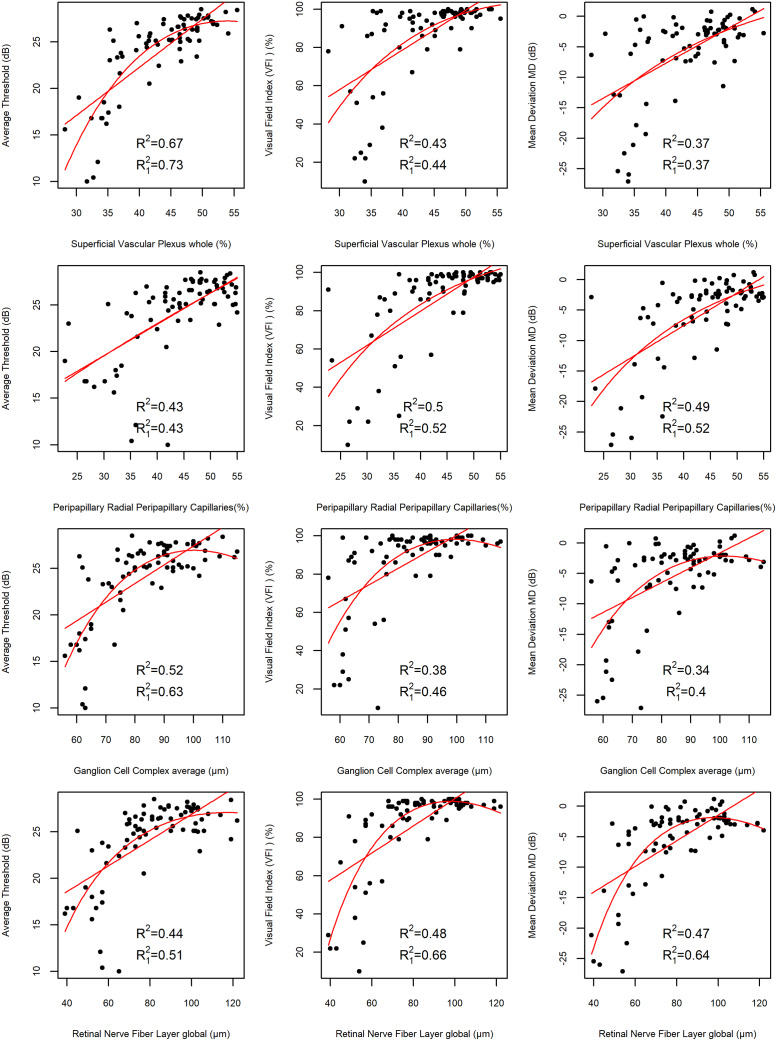
Fig 3. Scatter plots illustrating the correlation between structural and functional parameters with linear and quadratic regression curves.
The first column shows dependence between average sensitivity threshold and macular superficial retinal vascular plexus whole(SVP whole), average sensitivity threshold and peripapillary radial peripapillary capillaries (pRPC), average sensitivity threshold and ganglion cell complex (GCC), average sensitivity threshold and peripapillary retinal nerve fiber layer (pRNFL). The second column illustrates correlation between visual field index (VFI) and macular SVP whole, VFI and pRPC, VFI and GCC, VFI and pRNFL. The third column shows dependence between mean deviation (MD) and macular SVP whole, MD and pRPC, MD and GCC, MD and pRNFL. Additionally the values of the adjusted coefficient of determination for the linear (R2) and quadratic dependence (R12) for the depicted variables, obtained from the LMM fit adjusted for age, inter-eye correlation and SQ (where applicable) are shown.

