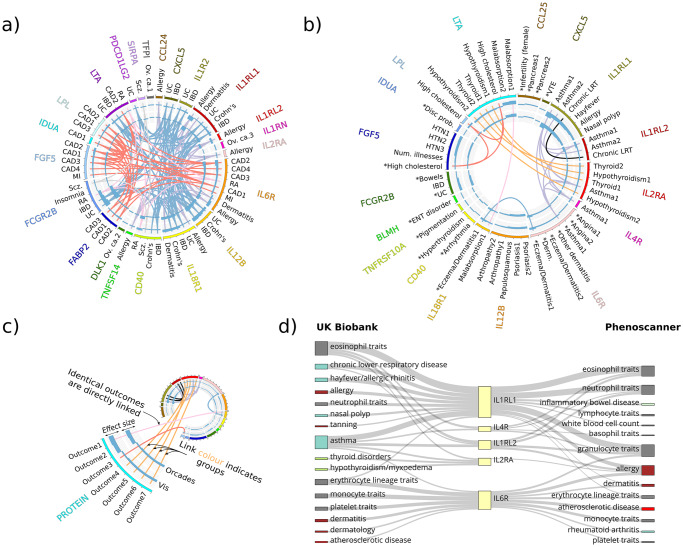
Fig 2. Significant (FDR <0.05) proteome-by-phenome MR protein-outcome causal inferences: Disease subset.
MR significant (FDR<5%) protein-disease outcome results. a) All MR significant (FDR<5%) protein-disease outcome results for outcomes from the Phenoscanner [21,22] studies (see key for details). b) All MR significant (FDR<5%) protein-disease outcome results for outcomes from GeneAtlas [20]. An asterisk indicates MR estimates that are not significantly heterogeneous upon HEIDI testing (see key for details). c) Key. From the outside in: HGNC symbol of the protein (exposure); disease outcome; key color (matching the protein name in the outer ring); bar chart of the signed squared beta estimate divided by the squared standard error of the MR estimate, using pQTL data from the discovery cohort (CROATIA-Vis); bar chart of the signed squared beta estimate divided by the squared standard error of the MR estimate, using pQTL data from the replication cohort (ORCADES). Central links join identical outcomes for which more than one protein was found to be MR significant. The color of the links indicates similar outcome groups, e.g. thyroid disease. The key to the outcome descriptions is detailed further in S9 and S10 Tables. d) Example concordance (due to sample overlap) plot for all proteins with significant MR evidence in GeneAtlas for causal roles in asthma (IL1RL1, IL1RL2, IL2RA, IL4R, IL6R). GeneAtlas traits are on the left. Phenoscanner traits are on the right. Thickness of connecting lines is proportional to -log10(p-value). The Phenoscanner studies included here are derived from [24,26,27,30,38,41–43], of which [26,38,42,43] include at least some part of the UKBB data. However, [26,42,43] use only data from the first phase (~150,000 individuals) genotype release from UK Biobank.

